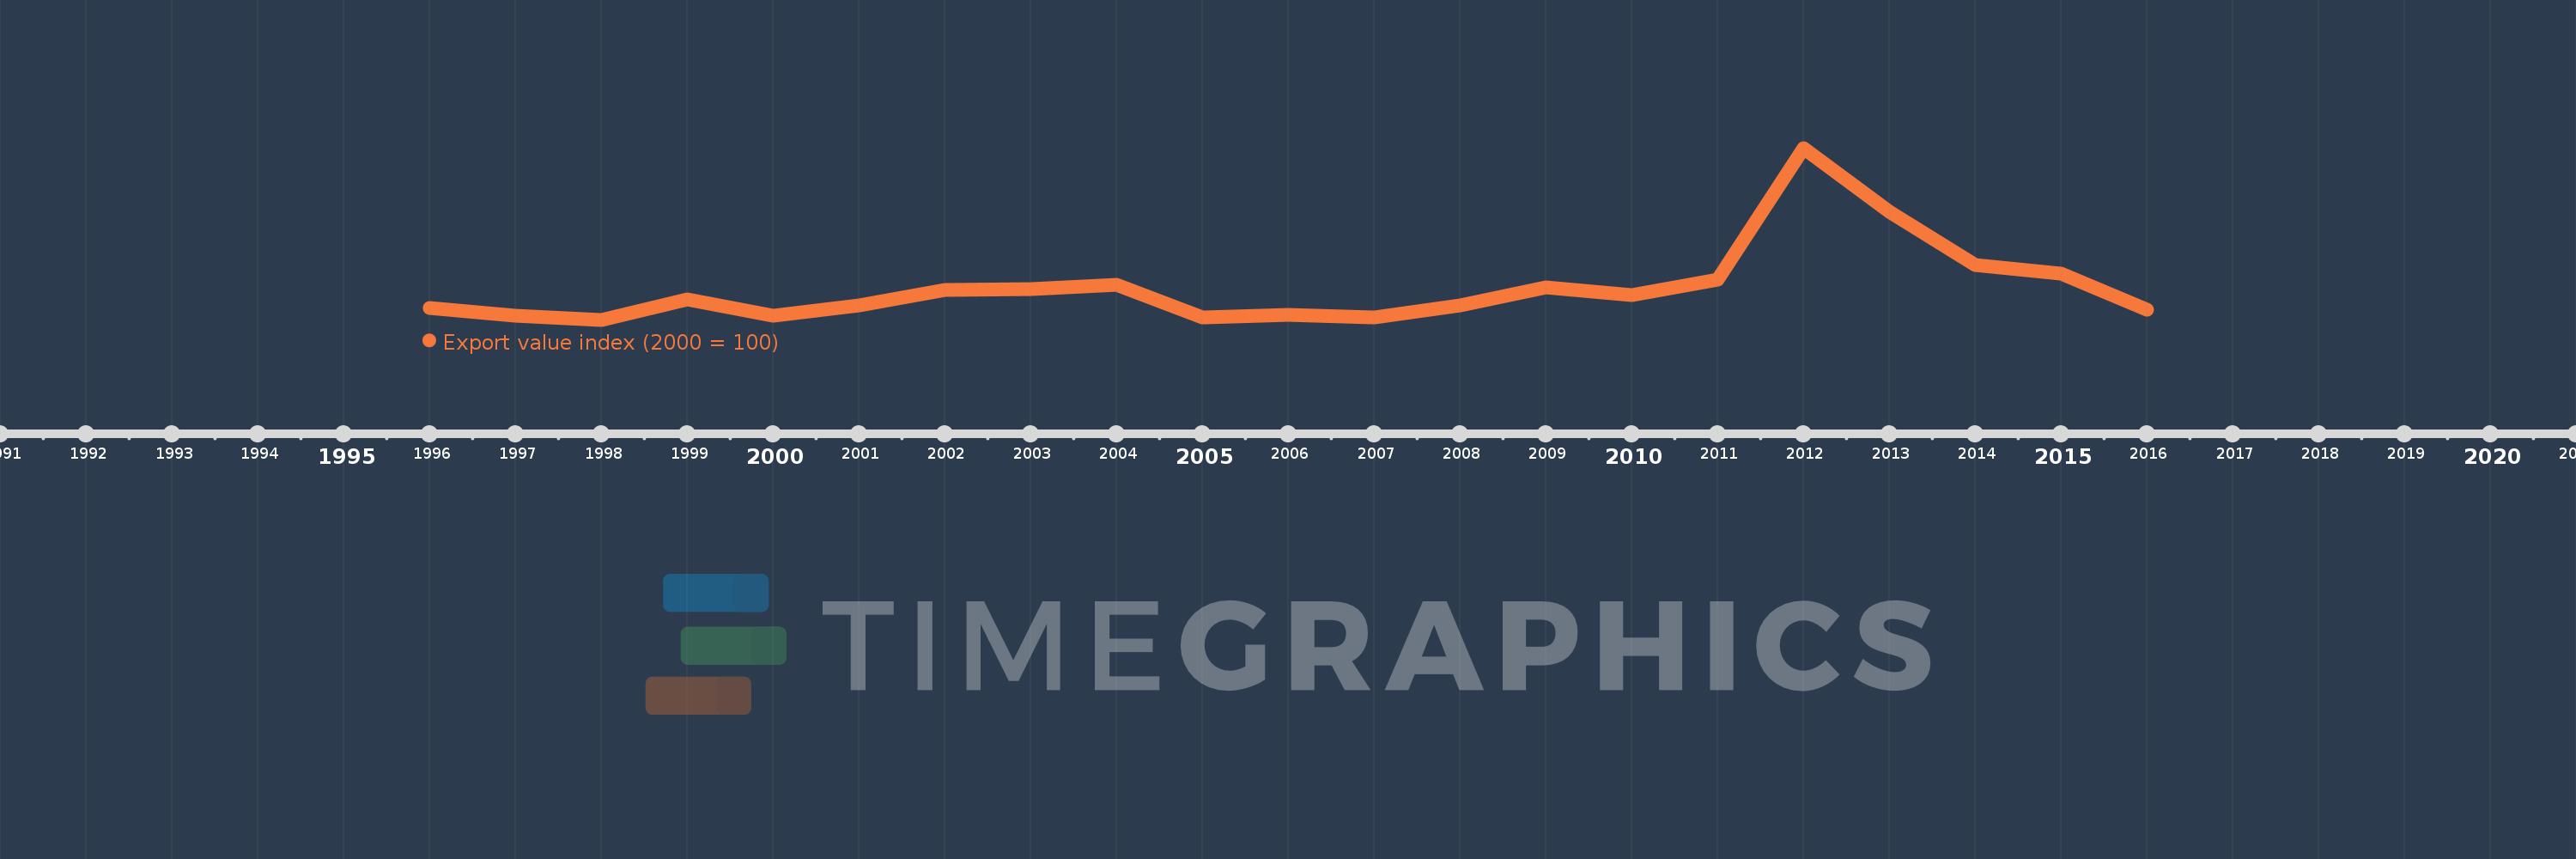
This timeline shows a graph from 1996 to 2016 of Micronesia, Fed. Sts.. No data until 1995. Number of actual observations by date: 21.
Source name:
World Development Indicators
Source organization:
United Nations Conference on Trade and Development, Handbook of Statistics and data files, and International Monetary Fund, International Financial Statistics.
Categories, topics:
Private Sector, Trade
Last updated:
apr 23, 2017
Indicators value changes by year
Meaning:
125.487
Minimum:
77.975
jan 1, 1998
Maximum:
337.078
jan 1, 2012
At the date of observation
Value
Absolute change
Change from the previous value
jan 1, 1996
95.195
+95.195
0.0%
jan 1, 1997
83.956
-11.239
-11.81%
jan 1, 1998
77.975
-5.981
-7.12%
jan 1, 1999
108.786
+30.811
39.51%
jan 1, 2000
83.461
-25.325
-23.28%
jan 1, 2001
100.0
+16.539
19.82%
jan 1, 2002
122.65
+22.65
22.65%
jan 1, 2003
124.367
+1.717
1.4%
jan 1, 2004
130.806
+6.439
5.18%
jan 1, 2005
80.984
-49.822
-38.09%
jan 1, 2006
85.636
+4.652
5.74%
jan 1, 2007
81.47
-4.166
-4.86%
jan 1, 2008
99.523
+18.053
22.16%
jan 1, 2009
126.371
+26.848
26.98%
jan 1, 2010
115.262
-11.11
-8.79%
jan 1, 2011
139.121
+23.859
20.7%
jan 1, 2012
337.078
+197.958
142.29%
jan 1, 2013
241.365
-95.714
-28.4%
jan 1, 2014
160.51
-80.855
-33.5%
jan 1, 2015
148.128
-12.383
-7.71%
jan 1, 2016
92.58
-55.548
-37.5%
Ranking of countries by current statistics by years