29
/
en
AIzaSyAYiBZKx7MnpbEhh9jyipgxe19OcubqV5w
April 1, 2024
96165
Burundi
BDI
true
2
1
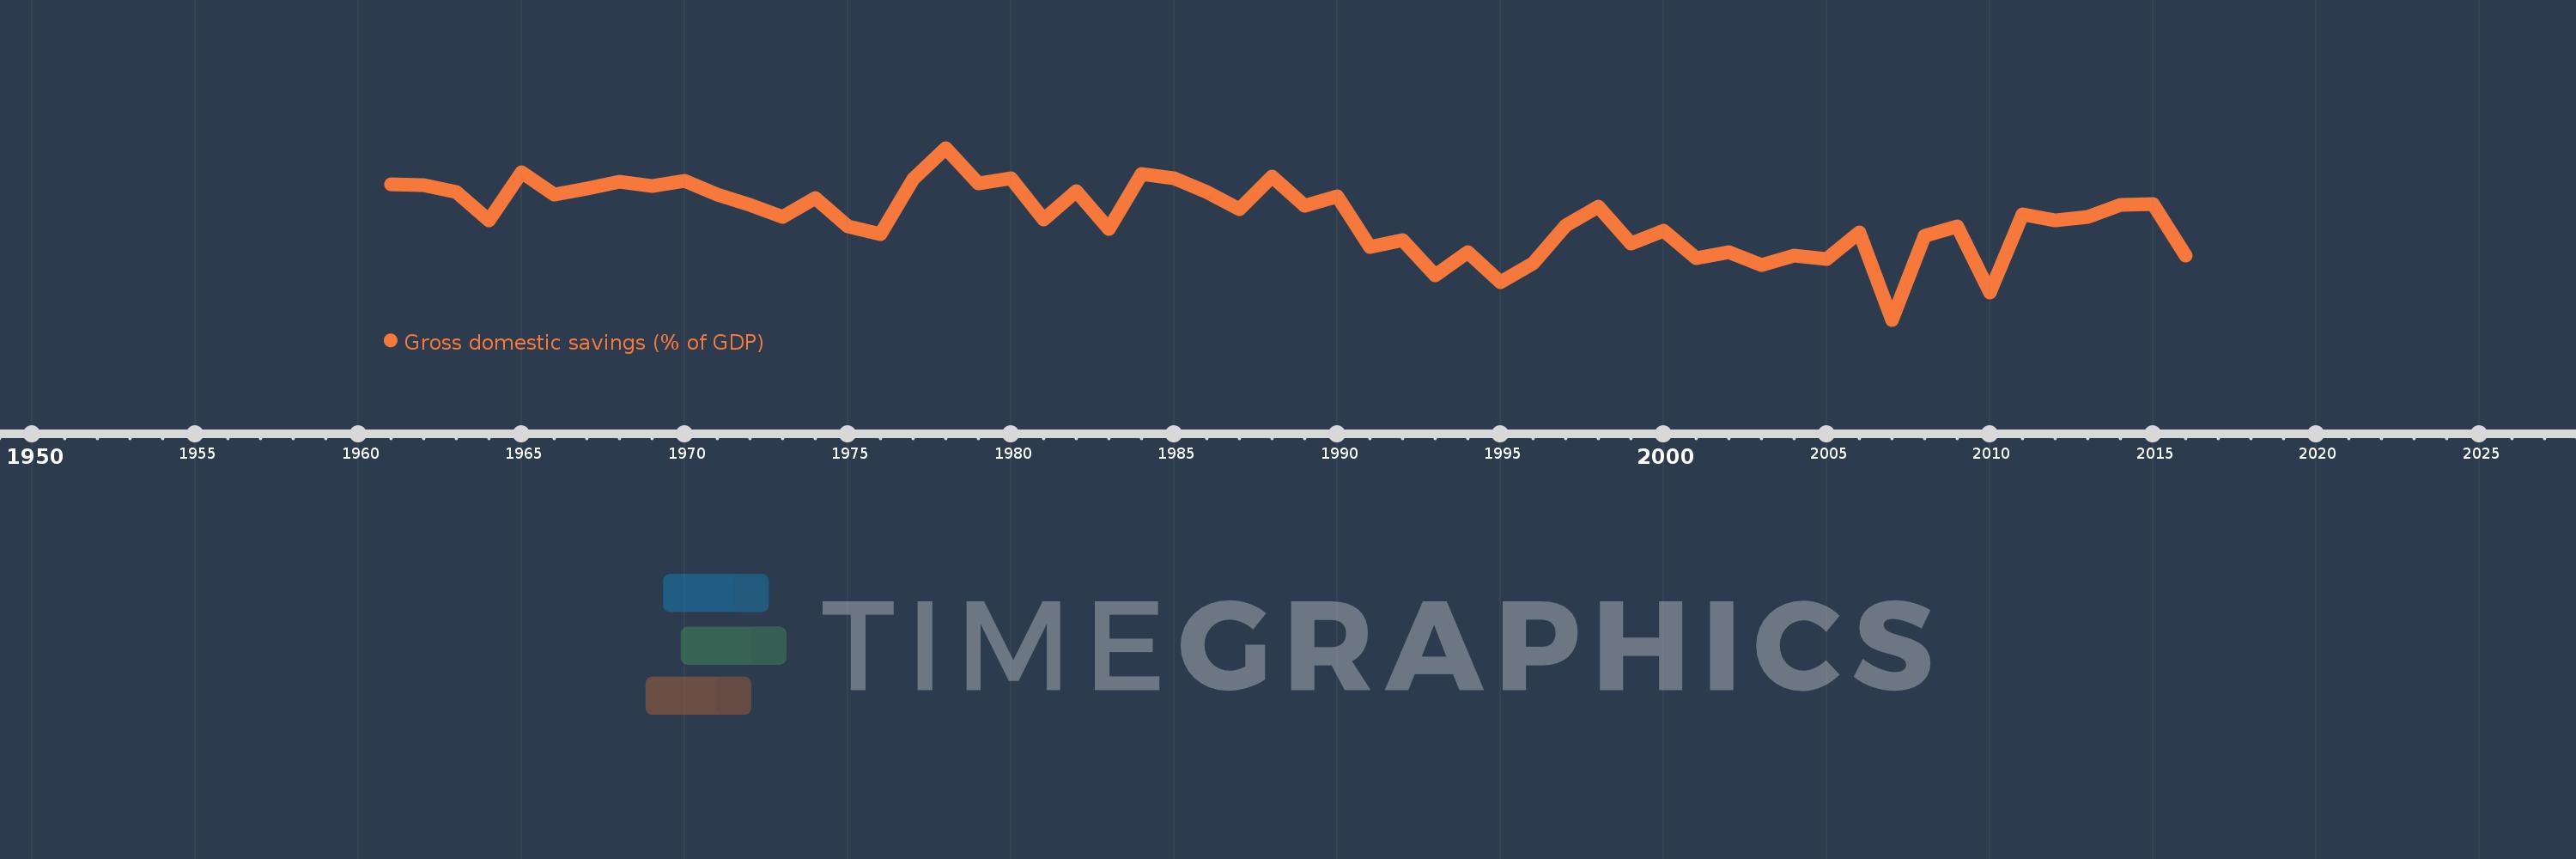
Gross domestic savings (% of GDP)
2016,2015,2014,2013,2012,2011,2010,2009,2008,2007,2006,2005,2004,2003,2002,2001,2000,1999,1998,1997,1996,1995,1994,1993,1992,1991,1990,1989,1988,1987,1986,1985,1984,1983,1982,1981,1980,1979,1978,1977,1976,1975,1974,1973,1972,1971,1970,1969,1968,1967,1966,1965,1964,1963,1962,1961
This statistics in other country:
AfghanistanAlbaniaAlgeriaAngolaAntigua and BarbudaArab WorldArgentinaArmeniaArubaAustraliaAustriaAzerbaijanBahamas, TheBahrainBangladeshBarbadosBelarusBelgiumBelizeBeninBermudaBhutanBoliviaBosnia and HerzegovinaBotswanaBrazilBrunei DarussalamBulgariaBurkina FasoBurundiCabo VerdeCambodiaCameroonCanadaCaribbean small statesCentral African RepublicCentral Europe and the BalticsChadChileChinaColombiaComorosCongo, Dem. Rep.Congo, Rep.Costa RicaCote d'IvoireCroatiaCubaCyprusCzech RepublicDenmarkDjiboutiDominicaDominican RepublicEarly-demographic dividendEast Asia & PacificEast Asia & Pacific (excluding high income)East Asia & Pacific (IDA & IBRD countries)EcuadorEgypt, Arab Rep.El SalvadorEquatorial GuineaEritreaEstoniaEthiopiaEuro areaEurope & Central AsiaEurope & Central Asia (excluding high income)Europe & Central Asia (IDA & IBRD countries)European UnionFaroe IslandsFijiFinlandFragile and conflict affected situationsFranceGabonGambia, TheGeorgiaGermanyGhanaGreeceGrenadaGuatemalaGuineaGuinea-BissauGuyanaHaitiHeavily indebted poor countries (HIPC)High incomeHondurasHong Kong SAR, ChinaHungaryIBRD onlyIcelandIDA & IBRD totalIDA blendIDA onlyIDA totalIndiaIndonesiaIran, Islamic Rep.IraqIrelandIsraelItalyJamaicaJapanJordanKazakhstanKenyaKiribatiKorea, Rep.KosovoKuwaitKyrgyz RepublicLao PDRLate-demographic dividendLatin America & Caribbean Latin America & Caribbean (excluding high income)Latin America & the Caribbean (IDA & IBRD countries)LatviaLeast developed countries: UN classificationLebanonLesothoLiberiaLibyaLithuaniaLow & middle incomeLow incomeLower middle incomeLuxembourgMacao SAR, ChinaMacedonia, FYRMadagascarMalawiMalaysiaMaldivesMaliMaltaMauritaniaMauritiusMexicoMicronesia, Fed. Sts.Middle East & North AfricaMiddle East & North Africa (excluding high income)Middle East & North Africa (IDA & IBRD countries)Middle incomeMoldovaMongoliaMontenegroMoroccoMozambiqueNamibiaNepalNetherlandsNew CaledoniaNew ZealandNicaraguaNigerNigeriaNorth AmericaNorwayOECD membersOmanOther small statesPacific island small statesPakistanPanamaPapua New GuineaParaguayPeruPhilippinesPolandPortugalPost-demographic dividendPre-demographic dividendPuerto RicoQatarRomaniaRussian FederationRwandaSaudi ArabiaSenegalSerbiaSeychellesSierra LeoneSingaporeSlovak RepublicSloveniaSmall statesSolomon IslandsSomaliaSouth AfricaSouth AsiaSouth Asia (IDA & IBRD)South SudanSpainSri LankaSt. Kitts and NevisSt. LuciaSt. Vincent and the GrenadinesSub-Saharan Africa Sub-Saharan Africa (excluding high income)Sub-Saharan Africa (IDA & IBRD countries)SudanSurinameSwazilandSwedenSwitzerlandSyrian Arab RepublicTajikistanTanzaniaThailandTimor-LesteTogoTongaTrinidad and TobagoTunisiaTurkeyTurkmenistanUgandaUkraineUnited Arab EmiratesUnited KingdomUnited StatesUpper middle incomeUruguayUzbekistanVanuatuVenezuela, RBVietnamWest Bank and GazaWorldYemen, Rep.ZambiaZimbabwe Timeline:
This timeline shows a graph from 1961 to 2016 of Burundi. No data until 1960. Number of actual observations by date: 56.
Source name:
World Development Indicators
Source organization:
World Bank national accounts data, and OECD National Accounts data files.
Categories, topics:
Economy & Growth
Last updated:
apr 23, 2017
Indicators value changes by year
Minimum:
-17.632
jan 1, 2007
Maximum:
11.501
jan 1, 1978
At the date of observation
Value
Absolute change
Change from previous value
jan 1, 1961
5.357
+5.357
0.0%
jan 1, 1962
5.172
-0.185
-3.45%
jan 1, 1963
4.098
-1.074
-20.77%
jan 1, 1964
-0.752
-4.85
-118.35%
jan 1, 1965
7.383
+8.134
-1.08K%
jan 1, 1966
3.58
-3.802
-51.5%
jan 1, 1967
4.552
+0.971
27.13%
jan 1, 1968
5.766
+1.215
26.69%
jan 1, 1969
5.119
-0.648
-11.23%
jan 1, 1970
5.853
+0.734
14.35%
jan 1, 1971
3.599
-2.254
-38.52%
jan 1, 1972
1.872
-1.727
-47.99%
jan 1, 1973
-0.159
-2.031
-108.49%
jan 1, 1974
2.995
+3.154
-1.99K%
jan 1, 1975
-1.728
-4.724
-157.7%
jan 1, 1976
-3.146
-1.418
82.04%
jan 1, 1977
6.162
+9.308
-295.87%
jan 1, 1978
11.501
+5.339
86.64%
jan 1, 1979
5.518
-5.982
-52.02%
jan 1, 1980
6.357
+0.839
15.2%
jan 1, 1981
-0.597
-6.954
-109.39%
jan 1, 1982
4.112
+4.709
-788.85%
jan 1, 1983
-2.238
-6.35
-154.43%
jan 1, 1984
7.125
+9.363
-418.34%
jan 1, 1985
6.323
-0.802
-11.26%
jan 1, 1986
4.101
-2.222
-35.14%
jan 1, 1987
1.052
-3.049
-74.35%
jan 1, 1988
6.619
+5.567
529.25%
jan 1, 1989
1.673
-4.946
-74.73%
jan 1, 1990
3.265
+1.592
95.19%
jan 1, 1991
-5.365
-8.63
-264.32%
jan 1, 1992
-4.178
+1.187
-22.13%
jan 1, 1993
-10.089
-5.911
141.49%
jan 1, 1994
-6.239
+3.851
-38.16%
jan 1, 1995
-11.236
-4.997
80.09%
jan 1, 1996
-7.989
+3.247
-28.9%
jan 1, 1997
-1.723
+6.265
-78.43%
jan 1, 1998
1.492
+3.216
-186.6%
jan 1, 1999
-4.669
-6.161
-412.84%
jan 1, 2000
-2.503
+2.166
-46.38%
jan 1, 2001
-7.135
-4.631
185.01%
jan 1, 2002
-6.137
+0.997
-13.98%
jan 1, 2003
-8.354
-2.216
36.11%
jan 1, 2004
-6.745
+1.609
-19.26%
jan 1, 2005
-7.324
-0.579
8.58%
jan 1, 2006
-2.869
+4.454
-60.82%
jan 1, 2007
-17.632
-14.763
514.56%
jan 1, 2008
-3.359
+14.274
-80.95%
jan 1, 2009
-1.77
+1.588
-47.29%
jan 1, 2010
-13.073
-11.303
638.4%
jan 1, 2011
0.257
+13.331
-101.97%
jan 1, 2012
-0.723
-0.98
-380.84%
jan 1, 2013
-0.146
+0.577
-79.85%
jan 1, 2014
1.896
+2.041
-1.4K%
jan 1, 2015
2.042
+0.146
7.72%
jan 1, 2016
-6.785
-8.827
-432.26%
Ranking of countries by current statistics by years


Comments: