29
/
en
AIzaSyAYiBZKx7MnpbEhh9jyipgxe19OcubqV5w
April 1, 2024
247595
Spain
ESP
true
2
1
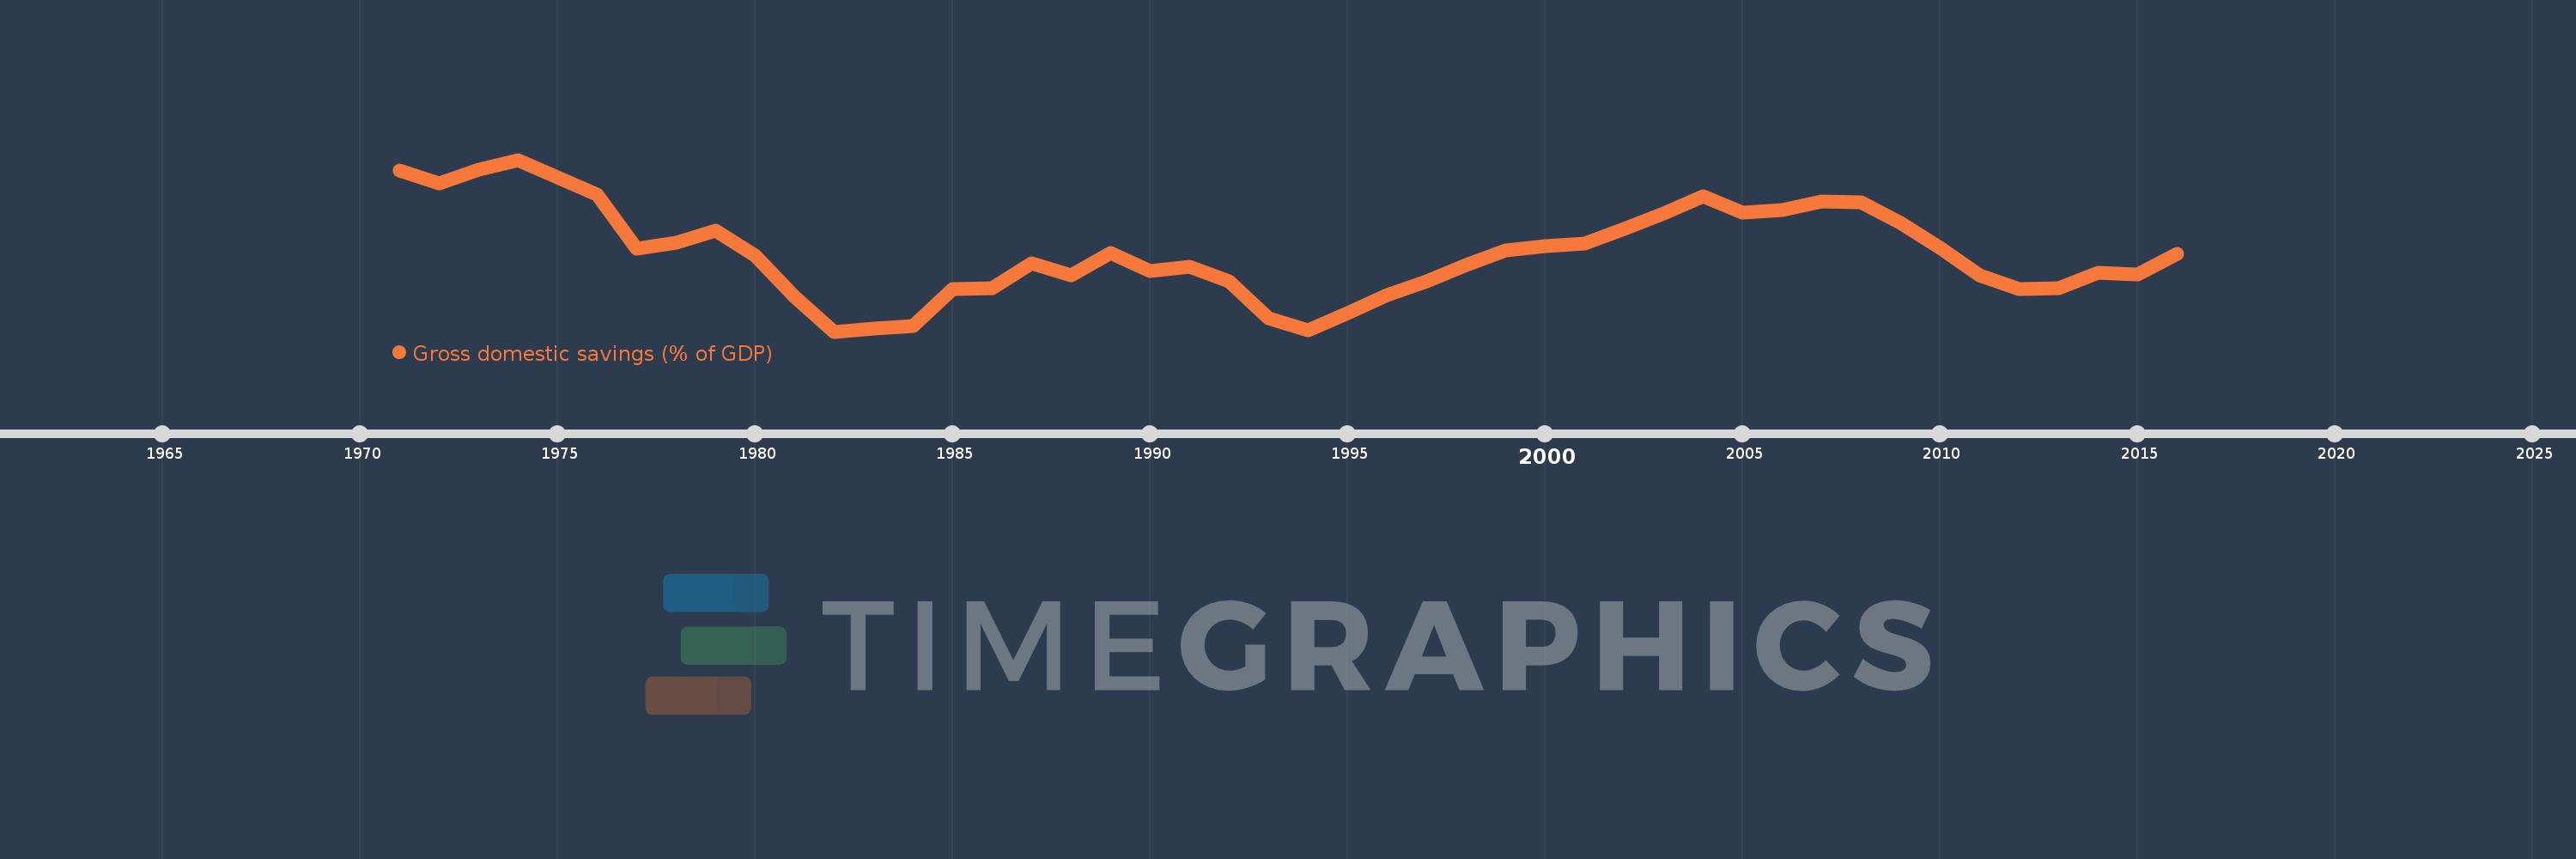
Gross domestic savings (% of GDP)
2016,2015,2014,2013,2012,2011,2010,2009,2008,2007,2006,2005,2004,2003,2002,2001,2000,1999,1998,1997,1996,1995,1994,1993,1992,1991,1990,1989,1988,1987,1986,1985,1984,1983,1982,1981,1980,1979,1978,1977,1976,1975,1974,1973,1972,1971
This statistics in other country:
AfghanistanAlbaniaAlgeriaAngolaAntigua and BarbudaArab WorldArgentinaArmeniaArubaAustraliaAustriaAzerbaijanBahamas, TheBahrainBangladeshBarbadosBelarusBelgiumBelizeBeninBermudaBhutanBoliviaBosnia and HerzegovinaBotswanaBrazilBrunei DarussalamBulgariaBurkina FasoBurundiCabo VerdeCambodiaCameroonCanadaCaribbean small statesCentral African RepublicCentral Europe and the BalticsChadChileChinaColombiaComorosCongo, Dem. Rep.Congo, Rep.Costa RicaCote d'IvoireCroatiaCubaCyprusCzech RepublicDenmarkDjiboutiDominicaDominican RepublicEarly-demographic dividendEast Asia & PacificEast Asia & Pacific (excluding high income)East Asia & Pacific (IDA & IBRD countries)EcuadorEgypt, Arab Rep.El SalvadorEquatorial GuineaEritreaEstoniaEthiopiaEuro areaEurope & Central AsiaEurope & Central Asia (excluding high income)Europe & Central Asia (IDA & IBRD countries)European UnionFaroe IslandsFijiFinlandFragile and conflict affected situationsFranceGabonGambia, TheGeorgiaGermanyGhanaGreeceGrenadaGuatemalaGuineaGuinea-BissauGuyanaHaitiHeavily indebted poor countries (HIPC)High incomeHondurasHong Kong SAR, ChinaHungaryIBRD onlyIcelandIDA & IBRD totalIDA blendIDA onlyIDA totalIndiaIndonesiaIran, Islamic Rep.IraqIrelandIsraelItalyJamaicaJapanJordanKazakhstanKenyaKiribatiKorea, Rep.KosovoKuwaitKyrgyz RepublicLao PDRLate-demographic dividendLatin America & Caribbean Latin America & Caribbean (excluding high income)Latin America & the Caribbean (IDA & IBRD countries)LatviaLeast developed countries: UN classificationLebanonLesothoLiberiaLibyaLithuaniaLow & middle incomeLow incomeLower middle incomeLuxembourgMacao SAR, ChinaMacedonia, FYRMadagascarMalawiMalaysiaMaldivesMaliMaltaMauritaniaMauritiusMexicoMicronesia, Fed. Sts.Middle East & North AfricaMiddle East & North Africa (excluding high income)Middle East & North Africa (IDA & IBRD countries)Middle incomeMoldovaMongoliaMontenegroMoroccoMozambiqueNamibiaNepalNetherlandsNew CaledoniaNew ZealandNicaraguaNigerNigeriaNorth AmericaNorwayOECD membersOmanOther small statesPacific island small statesPakistanPanamaPapua New GuineaParaguayPeruPhilippinesPolandPortugalPost-demographic dividendPre-demographic dividendPuerto RicoQatarRomaniaRussian FederationRwandaSaudi ArabiaSenegalSerbiaSeychellesSierra LeoneSingaporeSlovak RepublicSloveniaSmall statesSolomon IslandsSomaliaSouth AfricaSouth AsiaSouth Asia (IDA & IBRD)South SudanSpainSri LankaSt. Kitts and NevisSt. LuciaSt. Vincent and the GrenadinesSub-Saharan Africa Sub-Saharan Africa (excluding high income)Sub-Saharan Africa (IDA & IBRD countries)SudanSurinameSwazilandSwedenSwitzerlandSyrian Arab RepublicTajikistanTanzaniaThailandTimor-LesteTogoTongaTrinidad and TobagoTunisiaTurkeyTurkmenistanUgandaUkraineUnited Arab EmiratesUnited KingdomUnited StatesUpper middle incomeUruguayUzbekistanVanuatuVenezuela, RBVietnamWest Bank and GazaWorldYemen, Rep.ZambiaZimbabwe Timeline:
This timeline shows a graph from 1971 to 2016 of Spain. No data until 1970. Number of actual observations by date: 46.
Source name:
World Development Indicators
Source organization:
World Bank national accounts data, and OECD National Accounts data files.
Categories, topics:
Economy & Growth
Last updated:
apr 23, 2017
Indicators value changes by year
Minimum:
19.862
jan 1, 1982
Maximum:
27.139
jan 1, 1974
At the date of observation
Value
Absolute change
Change from previous value
jan 1, 1971
26.697
+26.697
0.0%
jan 1, 1972
26.121
-0.577
-2.16%
jan 1, 1973
26.722
+0.601
2.3%
jan 1, 1974
27.139
+0.417
1.56%
jan 1, 1975
26.41
-0.728
-2.68%
jan 1, 1976
25.669
-0.742
-2.81%
jan 1, 1977
23.383
-2.286
-8.9%
jan 1, 1978
23.628
+0.245
1.05%
jan 1, 1979
24.141
+0.513
2.17%
jan 1, 1980
23.075
-1.066
-4.41%
jan 1, 1981
21.337
-1.739
-7.53%
jan 1, 1982
19.862
-1.475
-6.91%
jan 1, 1983
19.982
+0.12
0.61%
jan 1, 1984
20.102
+0.12
0.6%
jan 1, 1985
21.67
+1.567
7.8%
jan 1, 1986
21.687
+0.017
0.08%
jan 1, 1987
22.755
+1.068
4.93%
jan 1, 1988
22.261
-0.494
-2.17%
jan 1, 1989
23.197
+0.936
4.2%
jan 1, 1990
22.443
-0.754
-3.25%
jan 1, 1991
22.615
+0.171
0.76%
jan 1, 1992
22.005
-0.61
-2.7%
jan 1, 1993
20.423
-1.582
-7.19%
jan 1, 1994
19.915
-0.508
-2.49%
jan 1, 1995
20.629
+0.714
3.58%
jan 1, 1996
21.402
+0.773
3.75%
jan 1, 1997
21.991
+0.588
2.75%
jan 1, 1998
22.698
+0.708
3.22%
jan 1, 1999
23.302
+0.603
2.66%
jan 1, 2000
23.481
+0.179
0.77%
jan 1, 2001
23.574
+0.093
0.39%
jan 1, 2002
24.223
+0.649
2.75%
jan 1, 2003
24.872
+0.649
2.68%
jan 1, 2004
25.607
+0.735
2.95%
jan 1, 2005
24.898
-0.708
-2.77%
jan 1, 2006
25.016
+0.118
0.47%
jan 1, 2007
25.381
+0.365
1.46%
jan 1, 2008
25.344
-0.036
-0.14%
jan 1, 2009
24.471
-0.874
-3.45%
jan 1, 2010
23.415
-1.056
-4.31%
jan 1, 2011
22.244
-1.171
-5.0%
jan 1, 2012
21.662
-0.582
-2.62%
jan 1, 2013
21.696
+0.033
0.15%
jan 1, 2014
22.35
+0.655
3.02%
jan 1, 2015
22.273
-0.077
-0.35%
jan 1, 2016
23.148
+0.875
3.93%
Ranking of countries by current statistics by years


Comments: