29
/
en
AIzaSyAYiBZKx7MnpbEhh9jyipgxe19OcubqV5w
April 1, 2024
103652
Chad
TCD
true
2
1
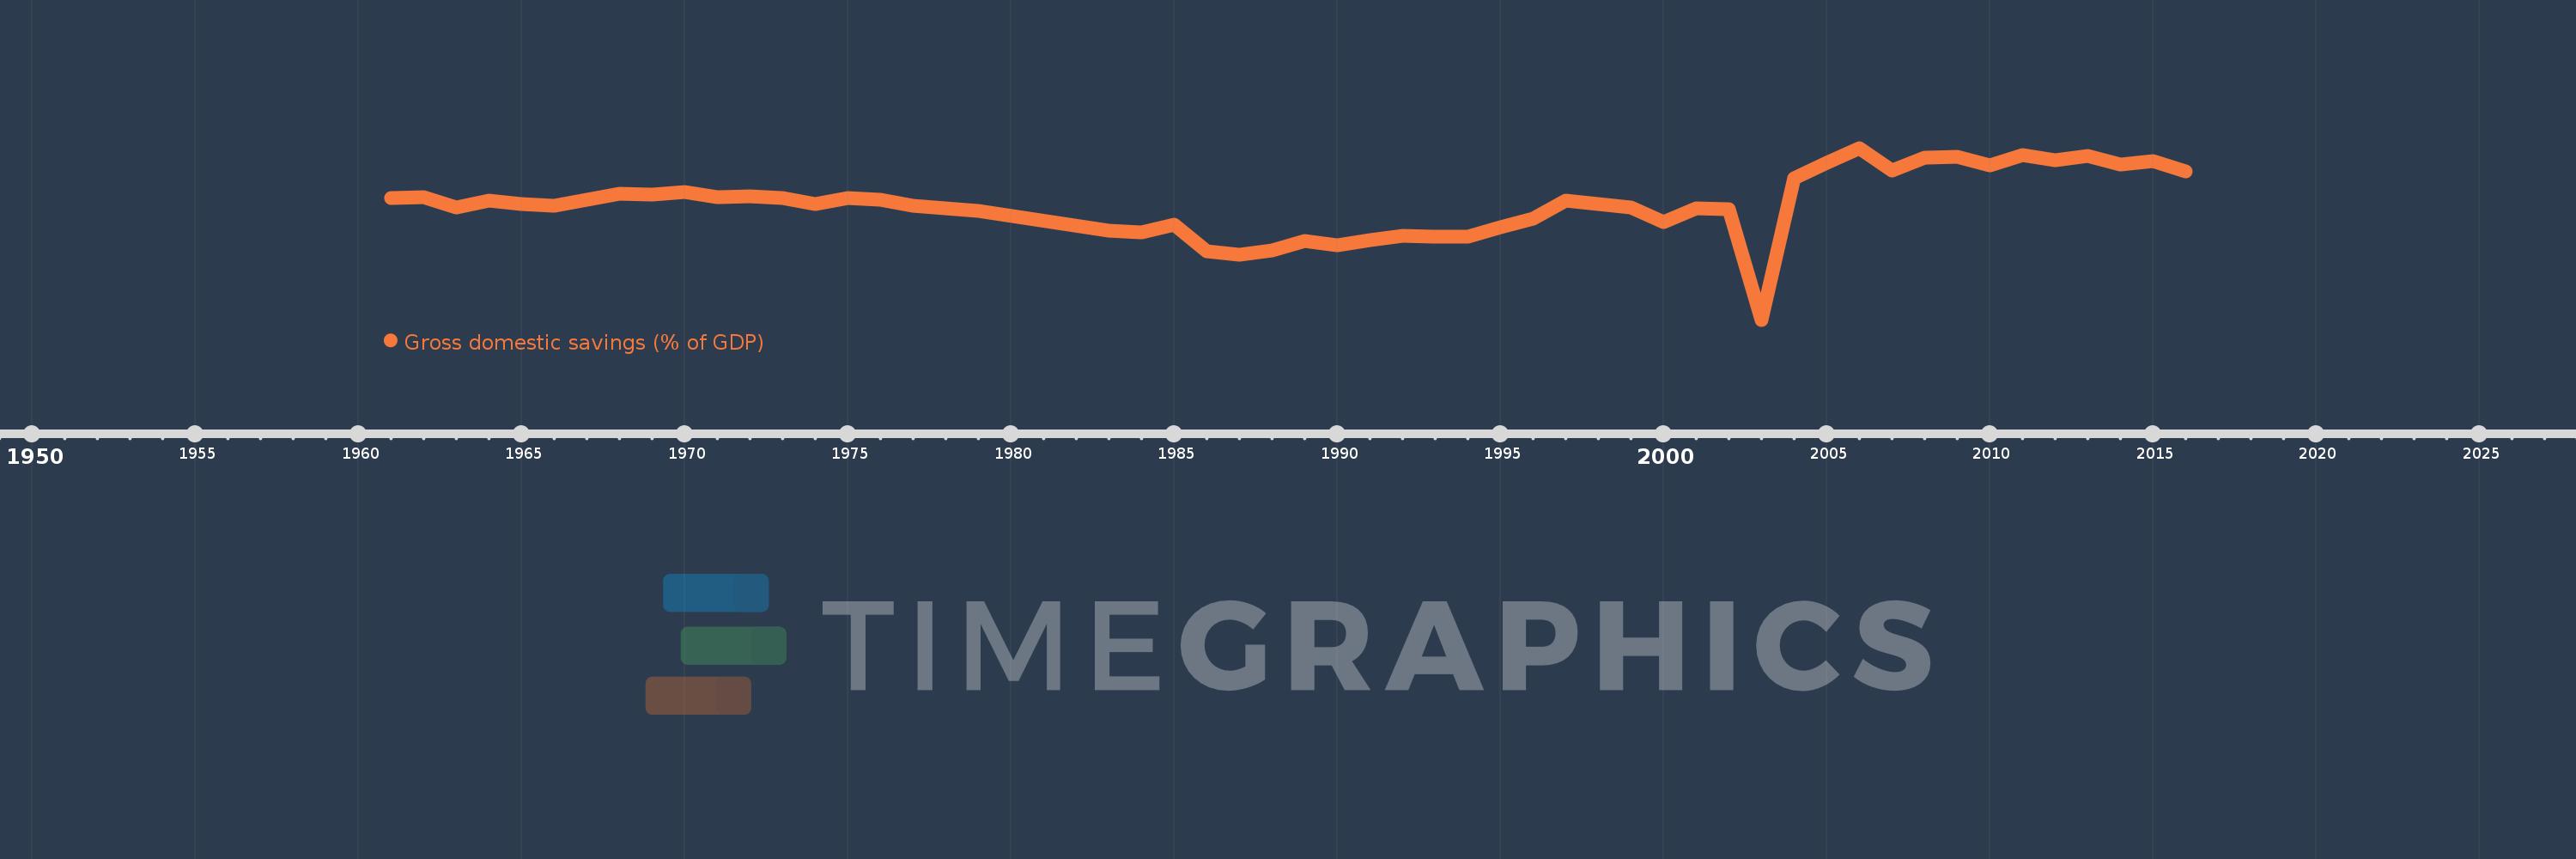
Gross domestic savings (% of GDP)
2016,2015,2014,2013,2012,2011,2010,2009,2008,2007,2006,2005,2004,2003,2002,2001,2000,1999,1998,1997,1996,1995,1994,1993,1992,1991,1990,1989,1988,1987,1986,1985,1984,1983,1979,1978,1977,1976,1975,1974,1973,1972,1971,1970,1969,1968,1967,1966,1965,1964,1963,1962,1961
This statistics in other country:
AfghanistanAlbaniaAlgeriaAngolaAntigua and BarbudaArab WorldArgentinaArmeniaArubaAustraliaAustriaAzerbaijanBahamas, TheBahrainBangladeshBarbadosBelarusBelgiumBelizeBeninBermudaBhutanBoliviaBosnia and HerzegovinaBotswanaBrazilBrunei DarussalamBulgariaBurkina FasoBurundiCabo VerdeCambodiaCameroonCanadaCaribbean small statesCentral African RepublicCentral Europe and the BalticsChadChileChinaColombiaComorosCongo, Dem. Rep.Congo, Rep.Costa RicaCote d'IvoireCroatiaCubaCyprusCzech RepublicDenmarkDjiboutiDominicaDominican RepublicEarly-demographic dividendEast Asia & PacificEast Asia & Pacific (excluding high income)East Asia & Pacific (IDA & IBRD countries)EcuadorEgypt, Arab Rep.El SalvadorEquatorial GuineaEritreaEstoniaEthiopiaEuro areaEurope & Central AsiaEurope & Central Asia (excluding high income)Europe & Central Asia (IDA & IBRD countries)European UnionFaroe IslandsFijiFinlandFragile and conflict affected situationsFranceGabonGambia, TheGeorgiaGermanyGhanaGreeceGrenadaGuatemalaGuineaGuinea-BissauGuyanaHaitiHeavily indebted poor countries (HIPC)High incomeHondurasHong Kong SAR, ChinaHungaryIBRD onlyIcelandIDA & IBRD totalIDA blendIDA onlyIDA totalIndiaIndonesiaIran, Islamic Rep.IraqIrelandIsraelItalyJamaicaJapanJordanKazakhstanKenyaKiribatiKorea, Rep.KosovoKuwaitKyrgyz RepublicLao PDRLate-demographic dividendLatin America & Caribbean Latin America & Caribbean (excluding high income)Latin America & the Caribbean (IDA & IBRD countries)LatviaLeast developed countries: UN classificationLebanonLesothoLiberiaLibyaLithuaniaLow & middle incomeLow incomeLower middle incomeLuxembourgMacao SAR, ChinaMacedonia, FYRMadagascarMalawiMalaysiaMaldivesMaliMaltaMauritaniaMauritiusMexicoMicronesia, Fed. Sts.Middle East & North AfricaMiddle East & North Africa (excluding high income)Middle East & North Africa (IDA & IBRD countries)Middle incomeMoldovaMongoliaMontenegroMoroccoMozambiqueNamibiaNepalNetherlandsNew CaledoniaNew ZealandNicaraguaNigerNigeriaNorth AmericaNorwayOECD membersOmanOther small statesPacific island small statesPakistanPanamaPapua New GuineaParaguayPeruPhilippinesPolandPortugalPost-demographic dividendPre-demographic dividendPuerto RicoQatarRomaniaRussian FederationRwandaSaudi ArabiaSenegalSerbiaSeychellesSierra LeoneSingaporeSlovak RepublicSloveniaSmall statesSolomon IslandsSomaliaSouth AfricaSouth AsiaSouth Asia (IDA & IBRD)South SudanSpainSri LankaSt. Kitts and NevisSt. LuciaSt. Vincent and the GrenadinesSub-Saharan Africa Sub-Saharan Africa (excluding high income)Sub-Saharan Africa (IDA & IBRD countries)SudanSurinameSwazilandSwedenSwitzerlandSyrian Arab RepublicTajikistanTanzaniaThailandTimor-LesteTogoTongaTrinidad and TobagoTunisiaTurkeyTurkmenistanUgandaUkraineUnited Arab EmiratesUnited KingdomUnited StatesUpper middle incomeUruguayUzbekistanVanuatuVenezuela, RBVietnamWest Bank and GazaWorldYemen, Rep.ZambiaZimbabwe Timeline:
This timeline shows a graph from 1961 to 2016 of Chad. No data until 1960. Number of actual observations by date: 53.
Source name:
World Development Indicators
Source organization:
World Bank national accounts data, and OECD National Accounts data files.
Categories, topics:
Economy & Growth
Last updated:
apr 23, 2017
Indicators value changes by year
Minimum:
-40.815
jan 1, 2003
Maximum:
30.812
jan 1, 2006
At the date of observation
Value
Absolute change
Change from previous value
jan 1, 1961
9.926
+9.926
0.0%
jan 1, 1962
10.134
+0.209
2.1%
jan 1, 1963
6.074
-4.061
-40.07%
jan 1, 1964
8.86
+2.787
45.88%
jan 1, 1965
7.383
-1.477
-16.67%
jan 1, 1966
6.719
-0.664
-9.0%
jan 1, 1967
9.102
+2.383
35.47%
jan 1, 1968
11.854
+2.752
30.23%
jan 1, 1969
11.299
-0.554
-4.68%
jan 1, 1970
12.362
+1.063
9.41%
jan 1, 1971
10.303
-2.06
-16.66%
jan 1, 1972
10.746
+0.443
4.3%
jan 1, 1973
9.932
-0.814
-7.57%
jan 1, 1974
7.459
-2.473
-24.9%
jan 1, 1975
10.062
+2.603
34.9%
jan 1, 1976
9.08
-0.982
-9.76%
jan 1, 1977
6.754
-2.326
-25.62%
jan 1, 1978
5.496
-1.258
-18.62%
jan 1, 1979
4.686
-0.81
-14.73%
jan 1, 1983
-3.771
-8.458
-180.47%
jan 1, 1984
-4.39
-0.619
16.41%
jan 1, 1985
-1.205
+3.185
-72.55%
jan 1, 1986
-12.118
-10.913
905.79%
jan 1, 1987
-13.849
-1.731
14.28%
jan 1, 1988
-11.854
+1.995
-14.41%
jan 1, 1989
-8.05
+3.804
-32.09%
jan 1, 1990
-9.596
-1.547
19.21%
jan 1, 1991
-7.673
+1.923
-20.04%
jan 1, 1992
-5.903
+1.77
-23.07%
jan 1, 1993
-6.255
-0.352
5.96%
jan 1, 1994
-6.241
+0.014
-0.22%
jan 1, 1995
-2.137
+4.104
-65.76%
jan 1, 1996
1.354
+3.491
-163.35%
jan 1, 1997
8.727
+7.373
544.56%
jan 1, 1998
7.259
-1.468
-16.82%
jan 1, 1999
5.858
-1.401
-19.3%
jan 1, 2000
-0.18
-6.039
-103.07%
jan 1, 2001
5.483
+5.663
-3.14K%
jan 1, 2002
5.26
-0.223
-4.06%
jan 1, 2003
-40.815
-46.075
-875.94%
jan 1, 2004
18.009
+58.824
-144.12%
jan 1, 2005
24.533
+6.524
36.23%
jan 1, 2006
30.812
+6.279
25.59%
jan 1, 2007
21.449
-9.364
-30.39%
jan 1, 2008
26.591
+5.143
23.98%
jan 1, 2009
26.978
+0.387
1.46%
jan 1, 2010
23.398
-3.58
-13.27%
jan 1, 2011
27.78
+4.381
18.72%
jan 1, 2012
25.546
-2.234
-8.04%
jan 1, 2013
27.461
+1.915
7.5%
jan 1, 2014
23.735
-3.726
-13.57%
jan 1, 2015
25.456
+1.721
7.25%
jan 1, 2016
21.123
-4.333
-17.02%
Ranking of countries by current statistics by years


Comments: