29
/
en
AIzaSyAYiBZKx7MnpbEhh9jyipgxe19OcubqV5w
April 1, 2024
84139
Benin
BEN
true
2
1
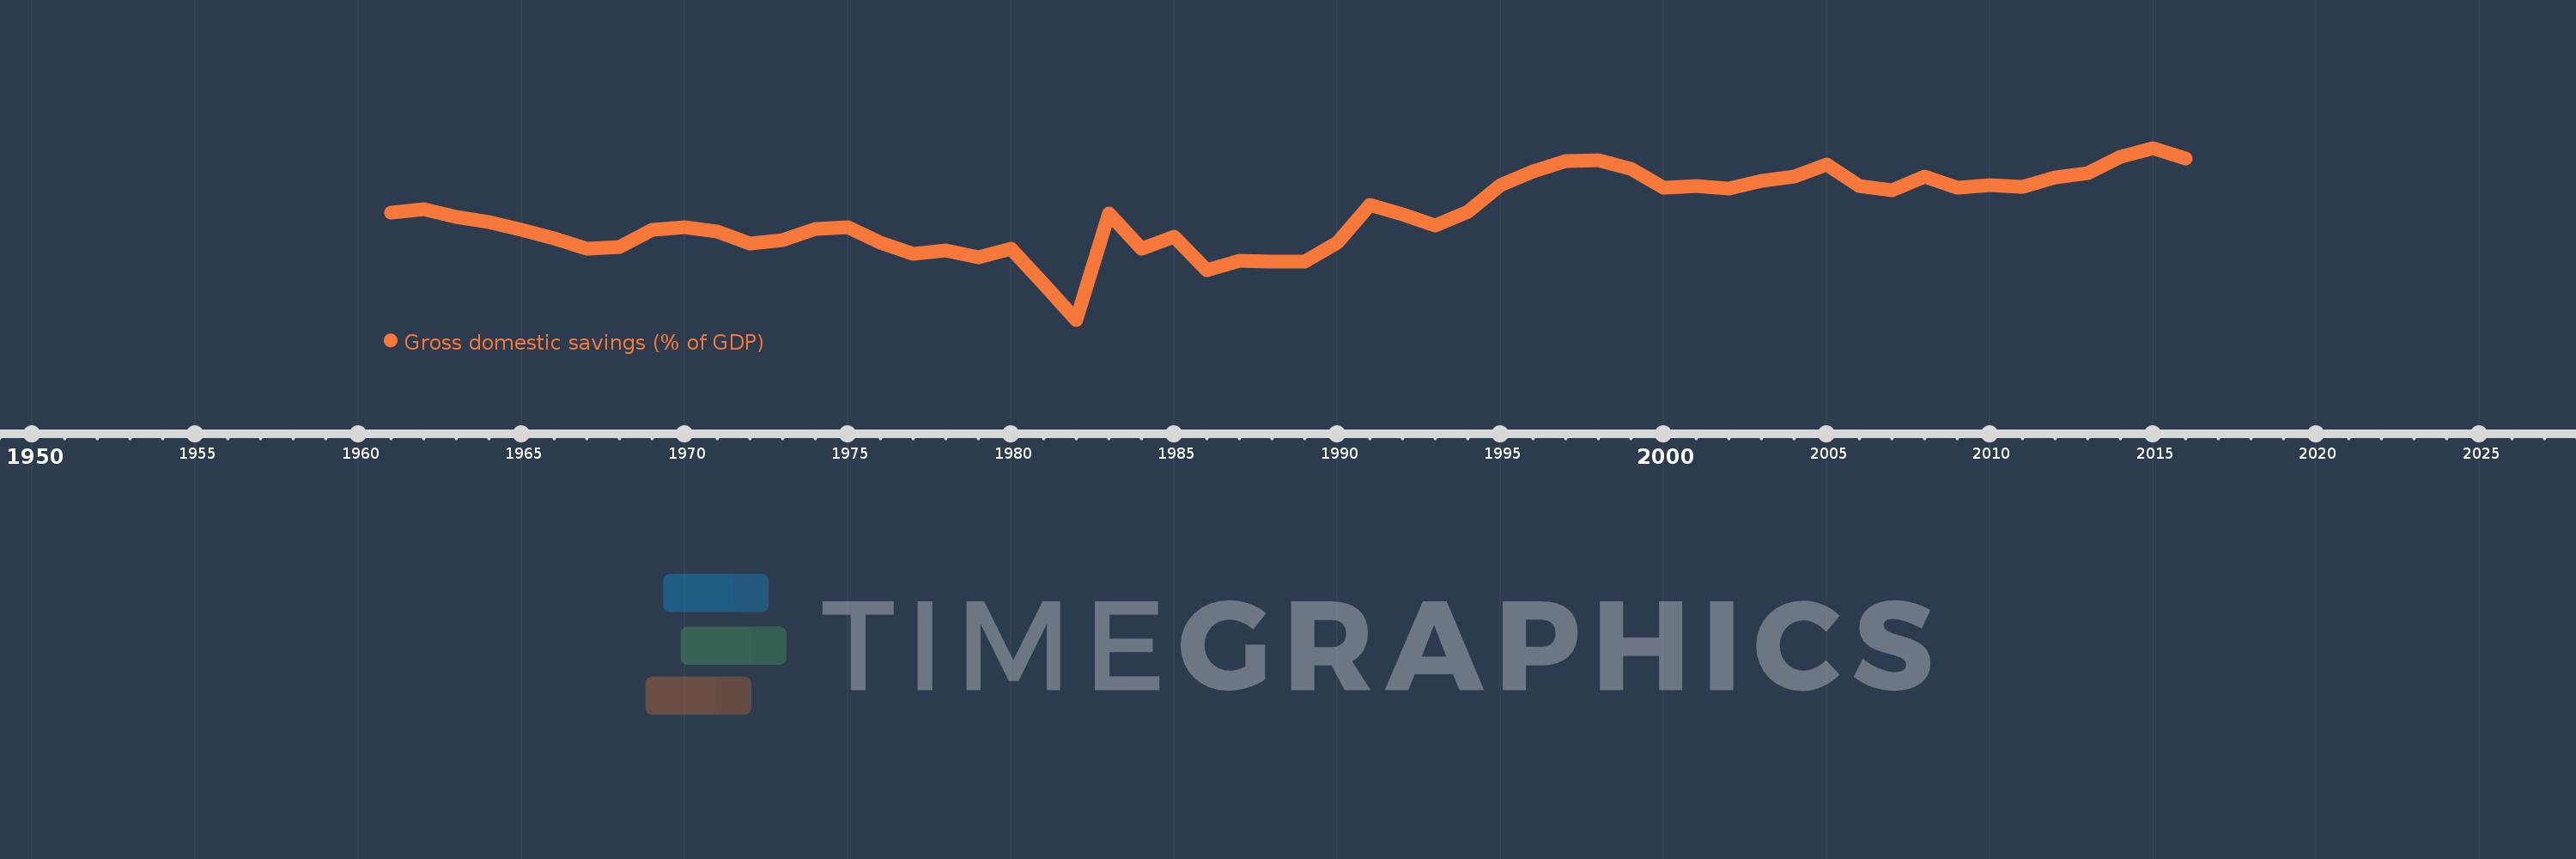
Gross domestic savings (% of GDP)
2016,2015,2014,2013,2012,2011,2010,2009,2008,2007,2006,2005,2004,2003,2002,2001,2000,1999,1998,1997,1996,1995,1994,1993,1992,1991,1990,1989,1988,1987,1986,1985,1984,1983,1982,1981,1980,1979,1978,1977,1976,1975,1974,1973,1972,1971,1970,1969,1968,1967,1966,1965,1964,1963,1962,1961
This statistics in other country:
AfghanistanAlbaniaAlgeriaAngolaAntigua and BarbudaArab WorldArgentinaArmeniaArubaAustraliaAustriaAzerbaijanBahamas, TheBahrainBangladeshBarbadosBelarusBelgiumBelizeBeninBermudaBhutanBoliviaBosnia and HerzegovinaBotswanaBrazilBrunei DarussalamBulgariaBurkina FasoBurundiCabo VerdeCambodiaCameroonCanadaCaribbean small statesCentral African RepublicCentral Europe and the BalticsChadChileChinaColombiaComorosCongo, Dem. Rep.Congo, Rep.Costa RicaCote d'IvoireCroatiaCubaCyprusCzech RepublicDenmarkDjiboutiDominicaDominican RepublicEarly-demographic dividendEast Asia & PacificEast Asia & Pacific (excluding high income)East Asia & Pacific (IDA & IBRD countries)EcuadorEgypt, Arab Rep.El SalvadorEquatorial GuineaEritreaEstoniaEthiopiaEuro areaEurope & Central AsiaEurope & Central Asia (excluding high income)Europe & Central Asia (IDA & IBRD countries)European UnionFaroe IslandsFijiFinlandFragile and conflict affected situationsFranceGabonGambia, TheGeorgiaGermanyGhanaGreeceGrenadaGuatemalaGuineaGuinea-BissauGuyanaHaitiHeavily indebted poor countries (HIPC)High incomeHondurasHong Kong SAR, ChinaHungaryIBRD onlyIcelandIDA & IBRD totalIDA blendIDA onlyIDA totalIndiaIndonesiaIran, Islamic Rep.IraqIrelandIsraelItalyJamaicaJapanJordanKazakhstanKenyaKiribatiKorea, Rep.KosovoKuwaitKyrgyz RepublicLao PDRLate-demographic dividendLatin America & Caribbean Latin America & Caribbean (excluding high income)Latin America & the Caribbean (IDA & IBRD countries)LatviaLeast developed countries: UN classificationLebanonLesothoLiberiaLibyaLithuaniaLow & middle incomeLow incomeLower middle incomeLuxembourgMacao SAR, ChinaMacedonia, FYRMadagascarMalawiMalaysiaMaldivesMaliMaltaMauritaniaMauritiusMexicoMicronesia, Fed. Sts.Middle East & North AfricaMiddle East & North Africa (excluding high income)Middle East & North Africa (IDA & IBRD countries)Middle incomeMoldovaMongoliaMontenegroMoroccoMozambiqueNamibiaNepalNetherlandsNew CaledoniaNew ZealandNicaraguaNigerNigeriaNorth AmericaNorwayOECD membersOmanOther small statesPacific island small statesPakistanPanamaPapua New GuineaParaguayPeruPhilippinesPolandPortugalPost-demographic dividendPre-demographic dividendPuerto RicoQatarRomaniaRussian FederationRwandaSaudi ArabiaSenegalSerbiaSeychellesSierra LeoneSingaporeSlovak RepublicSloveniaSmall statesSolomon IslandsSomaliaSouth AfricaSouth AsiaSouth Asia (IDA & IBRD)South SudanSpainSri LankaSt. Kitts and NevisSt. LuciaSt. Vincent and the GrenadinesSub-Saharan Africa Sub-Saharan Africa (excluding high income)Sub-Saharan Africa (IDA & IBRD countries)SudanSurinameSwazilandSwedenSwitzerlandSyrian Arab RepublicTajikistanTanzaniaThailandTimor-LesteTogoTongaTrinidad and TobagoTunisiaTurkeyTurkmenistanUgandaUkraineUnited Arab EmiratesUnited KingdomUnited StatesUpper middle incomeUruguayUzbekistanVanuatuVenezuela, RBVietnamWest Bank and GazaWorldYemen, Rep.ZambiaZimbabwe Timeline:
This timeline shows a graph from 1961 to 2016 of Benin. No data until 1960. Number of actual observations by date: 56.
Source name:
World Development Indicators
Source organization:
World Bank national accounts data, and OECD National Accounts data files.
Categories, topics:
Economy & Growth
Last updated:
apr 23, 2017
Indicators value changes by year
Minimum:
-12.352
jan 1, 1982
Maximum:
16.195
jan 1, 2015
At the date of observation
Value
Absolute change
Change from previous value
jan 1, 1961
5.439
+5.439
0.0%
jan 1, 1962
6.012
+0.573
10.54%
jan 1, 1963
4.668
-1.344
-22.36%
jan 1, 1964
3.812
-0.855
-18.33%
jan 1, 1965
2.628
-1.184
-31.06%
jan 1, 1966
1.139
-1.489
-56.65%
jan 1, 1967
-0.571
-1.711
-150.14%
jan 1, 1968
-0.281
+0.29
-50.76%
jan 1, 1969
2.633
+2.914
-1.04K%
jan 1, 1970
3.008
+0.375
14.25%
jan 1, 1971
2.308
-0.7
-23.28%
jan 1, 1972
0.239
-2.069
-89.65%
jan 1, 1973
0.948
+0.709
296.89%
jan 1, 1974
2.788
+1.84
194.1%
jan 1, 1975
3.053
+0.265
9.52%
jan 1, 1976
0.417
-2.636
-86.33%
jan 1, 1977
-1.385
-1.802
-431.87%
jan 1, 1978
-0.851
+0.534
-38.56%
jan 1, 1979
-1.956
-1.105
129.89%
jan 1, 1980
-0.483
+1.473
-75.3%
jan 1, 1981
-6.349
-5.866
1.21K%
jan 1, 1982
-12.352
-6.003
94.54%
jan 1, 1983
5.289
+17.641
-142.82%
jan 1, 1984
-0.492
-5.781
-109.3%
jan 1, 1985
1.428
+1.92
-390.24%
jan 1, 1986
-4.056
-5.484
-384.08%
jan 1, 1987
-2.475
+1.581
-38.98%
jan 1, 1988
-2.756
-0.281
11.35%
jan 1, 1989
-2.646
+0.11
-3.99%
jan 1, 1990
0.508
+3.154
-119.18%
jan 1, 1991
6.703
+6.195
1.22K%
jan 1, 1992
5.138
-1.564
-23.34%
jan 1, 1993
3.359
-1.78
-34.63%
jan 1, 1994
5.605
+2.246
66.89%
jan 1, 1995
10.056
+4.451
79.4%
jan 1, 1996
12.358
+2.302
22.89%
jan 1, 1997
14.031
+1.673
13.54%
jan 1, 1998
14.185
+0.154
1.1%
jan 1, 1999
12.747
-1.438
-10.14%
jan 1, 2000
9.613
-3.134
-24.59%
jan 1, 2001
9.857
+0.244
2.54%
jan 1, 2002
9.482
-0.374
-3.8%
jan 1, 2003
10.686
+1.203
12.69%
jan 1, 2004
11.42
+0.734
6.87%
jan 1, 2005
13.401
+1.982
17.35%
jan 1, 2006
9.859
-3.542
-26.43%
jan 1, 2007
9.164
-0.695
-7.05%
jan 1, 2008
11.451
+2.287
24.96%
jan 1, 2009
9.586
-1.864
-16.28%
jan 1, 2010
9.946
+0.359
3.75%
jan 1, 2011
9.716
-0.23
-2.31%
jan 1, 2012
11.318
+1.602
16.49%
jan 1, 2013
12.073
+0.756
6.68%
jan 1, 2014
14.658
+2.585
21.41%
jan 1, 2015
16.195
+1.537
10.49%
jan 1, 2016
14.397
-1.798
-11.1%
Ranking of countries by current statistics by years


Comments: