29
/
en
AIzaSyAYiBZKx7MnpbEhh9jyipgxe19OcubqV5w
April 1, 2024
205316
Namibia
NAM
true
2
1
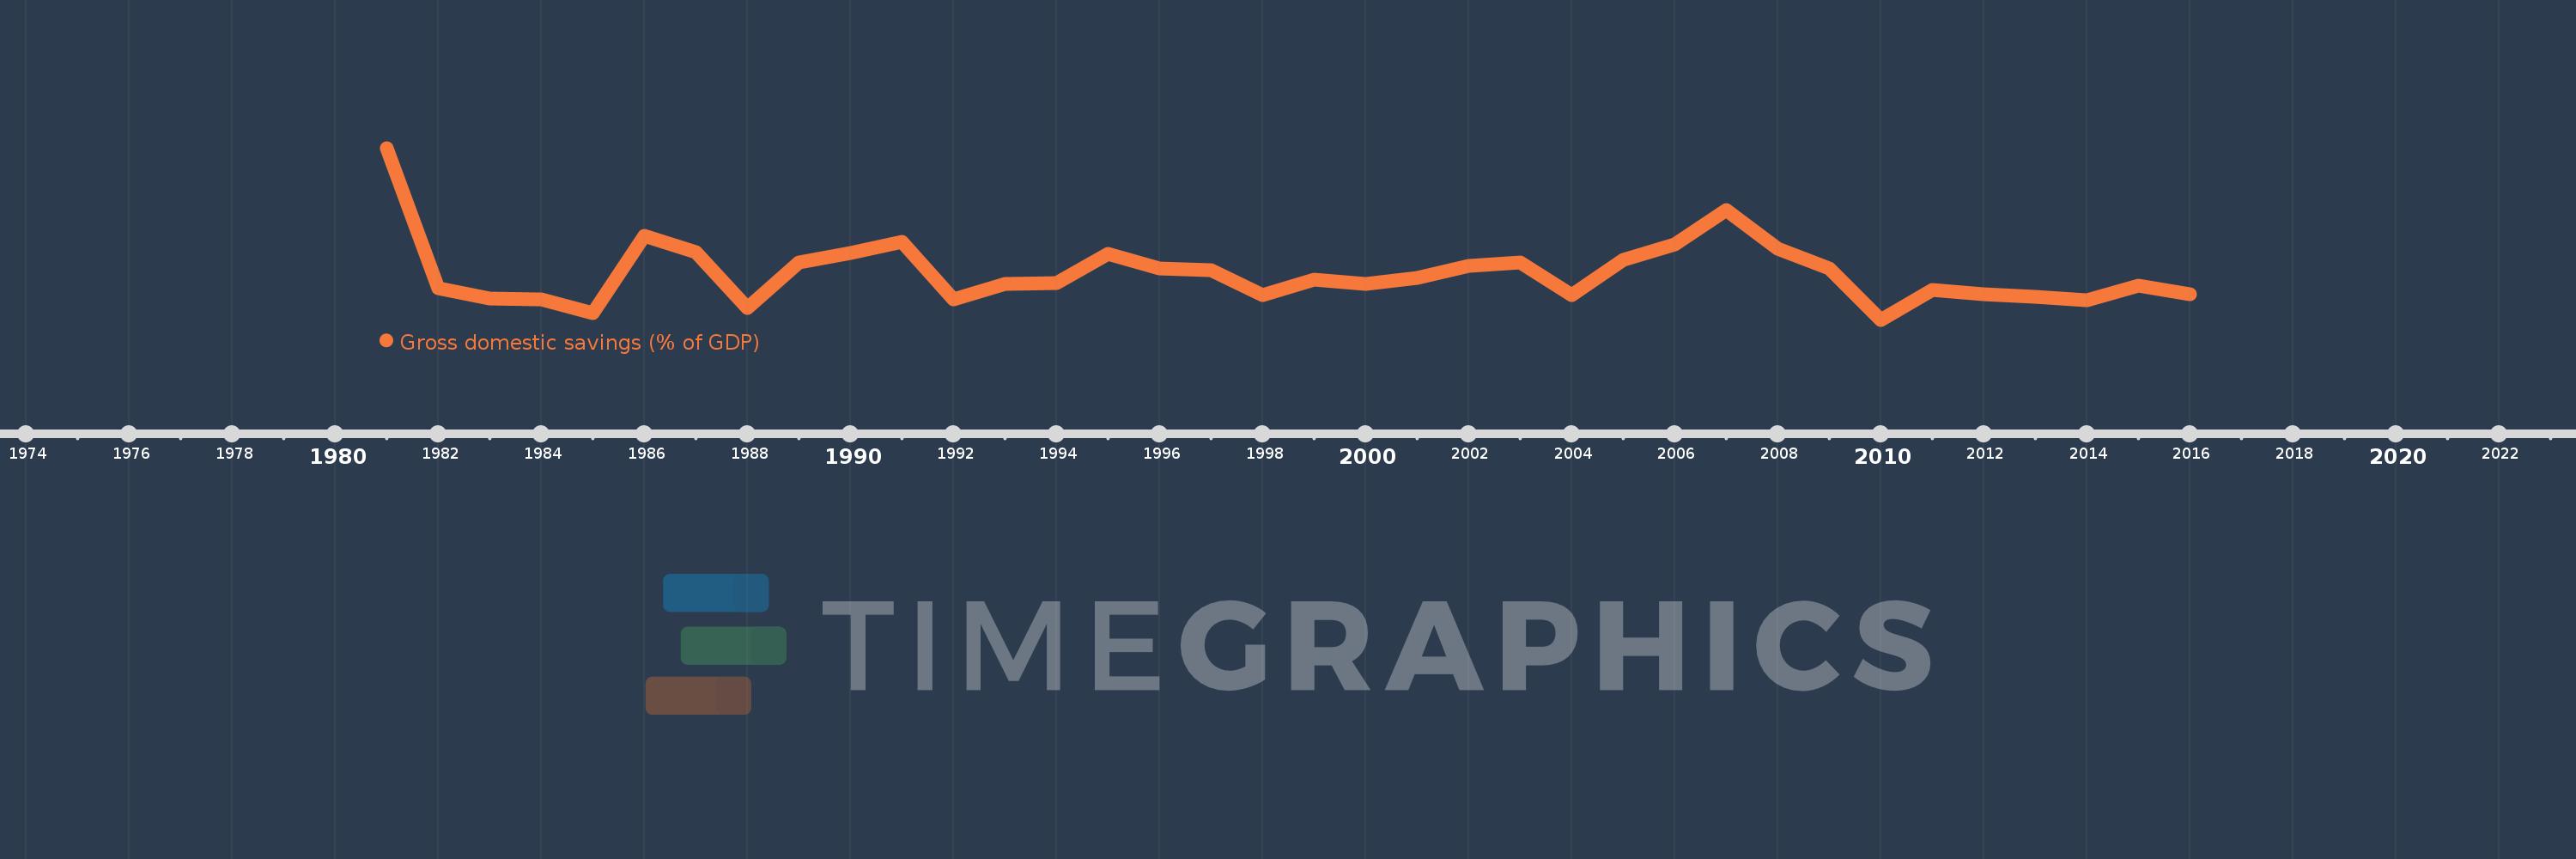
Gross domestic savings (% of GDP)
2016,2015,2014,2013,2012,2011,2010,2009,2008,2007,2006,2005,2004,2003,2002,2001,2000,1999,1998,1997,1996,1995,1994,1993,1992,1991,1990,1989,1988,1987,1986,1985,1984,1983,1982,1981
This statistics in other country:
AfghanistanAlbaniaAlgeriaAngolaAntigua and BarbudaArab WorldArgentinaArmeniaArubaAustraliaAustriaAzerbaijanBahamas, TheBahrainBangladeshBarbadosBelarusBelgiumBelizeBeninBermudaBhutanBoliviaBosnia and HerzegovinaBotswanaBrazilBrunei DarussalamBulgariaBurkina FasoBurundiCabo VerdeCambodiaCameroonCanadaCaribbean small statesCentral African RepublicCentral Europe and the BalticsChadChileChinaColombiaComorosCongo, Dem. Rep.Congo, Rep.Costa RicaCote d'IvoireCroatiaCubaCyprusCzech RepublicDenmarkDjiboutiDominicaDominican RepublicEarly-demographic dividendEast Asia & PacificEast Asia & Pacific (excluding high income)East Asia & Pacific (IDA & IBRD countries)EcuadorEgypt, Arab Rep.El SalvadorEquatorial GuineaEritreaEstoniaEthiopiaEuro areaEurope & Central AsiaEurope & Central Asia (excluding high income)Europe & Central Asia (IDA & IBRD countries)European UnionFaroe IslandsFijiFinlandFragile and conflict affected situationsFranceGabonGambia, TheGeorgiaGermanyGhanaGreeceGrenadaGuatemalaGuineaGuinea-BissauGuyanaHaitiHeavily indebted poor countries (HIPC)High incomeHondurasHong Kong SAR, ChinaHungaryIBRD onlyIcelandIDA & IBRD totalIDA blendIDA onlyIDA totalIndiaIndonesiaIran, Islamic Rep.IraqIrelandIsraelItalyJamaicaJapanJordanKazakhstanKenyaKiribatiKorea, Rep.KosovoKuwaitKyrgyz RepublicLao PDRLate-demographic dividendLatin America & Caribbean Latin America & Caribbean (excluding high income)Latin America & the Caribbean (IDA & IBRD countries)LatviaLeast developed countries: UN classificationLebanonLesothoLiberiaLibyaLithuaniaLow & middle incomeLow incomeLower middle incomeLuxembourgMacao SAR, ChinaMacedonia, FYRMadagascarMalawiMalaysiaMaldivesMaliMaltaMauritaniaMauritiusMexicoMicronesia, Fed. Sts.Middle East & North AfricaMiddle East & North Africa (excluding high income)Middle East & North Africa (IDA & IBRD countries)Middle incomeMoldovaMongoliaMontenegroMoroccoMozambiqueNamibiaNepalNetherlandsNew CaledoniaNew ZealandNicaraguaNigerNigeriaNorth AmericaNorwayOECD membersOmanOther small statesPacific island small statesPakistanPanamaPapua New GuineaParaguayPeruPhilippinesPolandPortugalPost-demographic dividendPre-demographic dividendPuerto RicoQatarRomaniaRussian FederationRwandaSaudi ArabiaSenegalSerbiaSeychellesSierra LeoneSingaporeSlovak RepublicSloveniaSmall statesSolomon IslandsSomaliaSouth AfricaSouth AsiaSouth Asia (IDA & IBRD)South SudanSpainSri LankaSt. Kitts and NevisSt. LuciaSt. Vincent and the GrenadinesSub-Saharan Africa Sub-Saharan Africa (excluding high income)Sub-Saharan Africa (IDA & IBRD countries)SudanSurinameSwazilandSwedenSwitzerlandSyrian Arab RepublicTajikistanTanzaniaThailandTimor-LesteTogoTongaTrinidad and TobagoTunisiaTurkeyTurkmenistanUgandaUkraineUnited Arab EmiratesUnited KingdomUnited StatesUpper middle incomeUruguayUzbekistanVanuatuVenezuela, RBVietnamWest Bank and GazaWorldYemen, Rep.ZambiaZimbabwe Timeline:
This timeline shows a graph from 1981 to 2016 of Namibia. No data until 1980. Number of actual observations by date: 36.
Source name:
World Development Indicators
Source organization:
World Bank national accounts data, and OECD National Accounts data files.
Categories, topics:
Economy & Growth
Last updated:
apr 23, 2017
Indicators value changes by year
Maximum:
37.833
jan 1, 1981
At the date of observation
Value
Absolute change
Change from previous value
jan 1, 1981
37.833
+37.833
0.0%
jan 1, 1982
11.601
-26.232
-69.34%
jan 1, 1983
9.628
-1.972
-17.0%
jan 1, 1984
9.432
-0.196
-2.04%
jan 1, 1985
6.985
-2.448
-25.95%
jan 1, 1986
21.317
+14.332
205.2%
jan 1, 1987
18.391
-2.926
-13.73%
jan 1, 1988
7.882
-10.509
-57.14%
jan 1, 1989
16.447
+8.566
108.68%
jan 1, 1990
18.098
+1.65
10.03%
jan 1, 1991
20.314
+2.217
12.25%
jan 1, 1992
9.501
-10.813
-53.23%
jan 1, 1993
12.439
+2.938
30.93%
jan 1, 1994
12.527
+0.087
0.7%
jan 1, 1995
17.931
+5.405
43.14%
jan 1, 1996
15.303
-2.628
-14.66%
jan 1, 1997
14.905
-0.398
-2.6%
jan 1, 1998
10.3
-4.605
-30.89%
jan 1, 1999
13.117
+2.817
27.35%
jan 1, 2000
12.431
-0.686
-5.23%
jan 1, 2001
13.428
+0.997
8.02%
jan 1, 2002
15.827
+2.399
17.87%
jan 1, 2003
16.452
+0.624
3.95%
jan 1, 2004
10.285
-6.167
-37.49%
jan 1, 2005
16.8
+6.515
63.35%
jan 1, 2006
19.828
+3.028
18.02%
jan 1, 2007
26.17
+6.342
31.99%
jan 1, 2008
19.029
-7.142
-27.29%
jan 1, 2009
15.334
-3.695
-19.42%
jan 1, 2010
5.669
-9.665
-63.03%
jan 1, 2011
11.225
+5.557
98.02%
jan 1, 2012
10.428
-0.798
-7.11%
jan 1, 2013
9.98
-0.448
-4.29%
jan 1, 2014
9.273
-0.707
-7.08%
jan 1, 2015
12.118
+2.844
30.67%
jan 1, 2016
10.381
-1.737
-14.33%
Ranking of countries by current statistics by years


Comments: