29
/
en
AIzaSyAYiBZKx7MnpbEhh9jyipgxe19OcubqV5w
April 1, 2024
214359
Norway
NOR
true
2
1
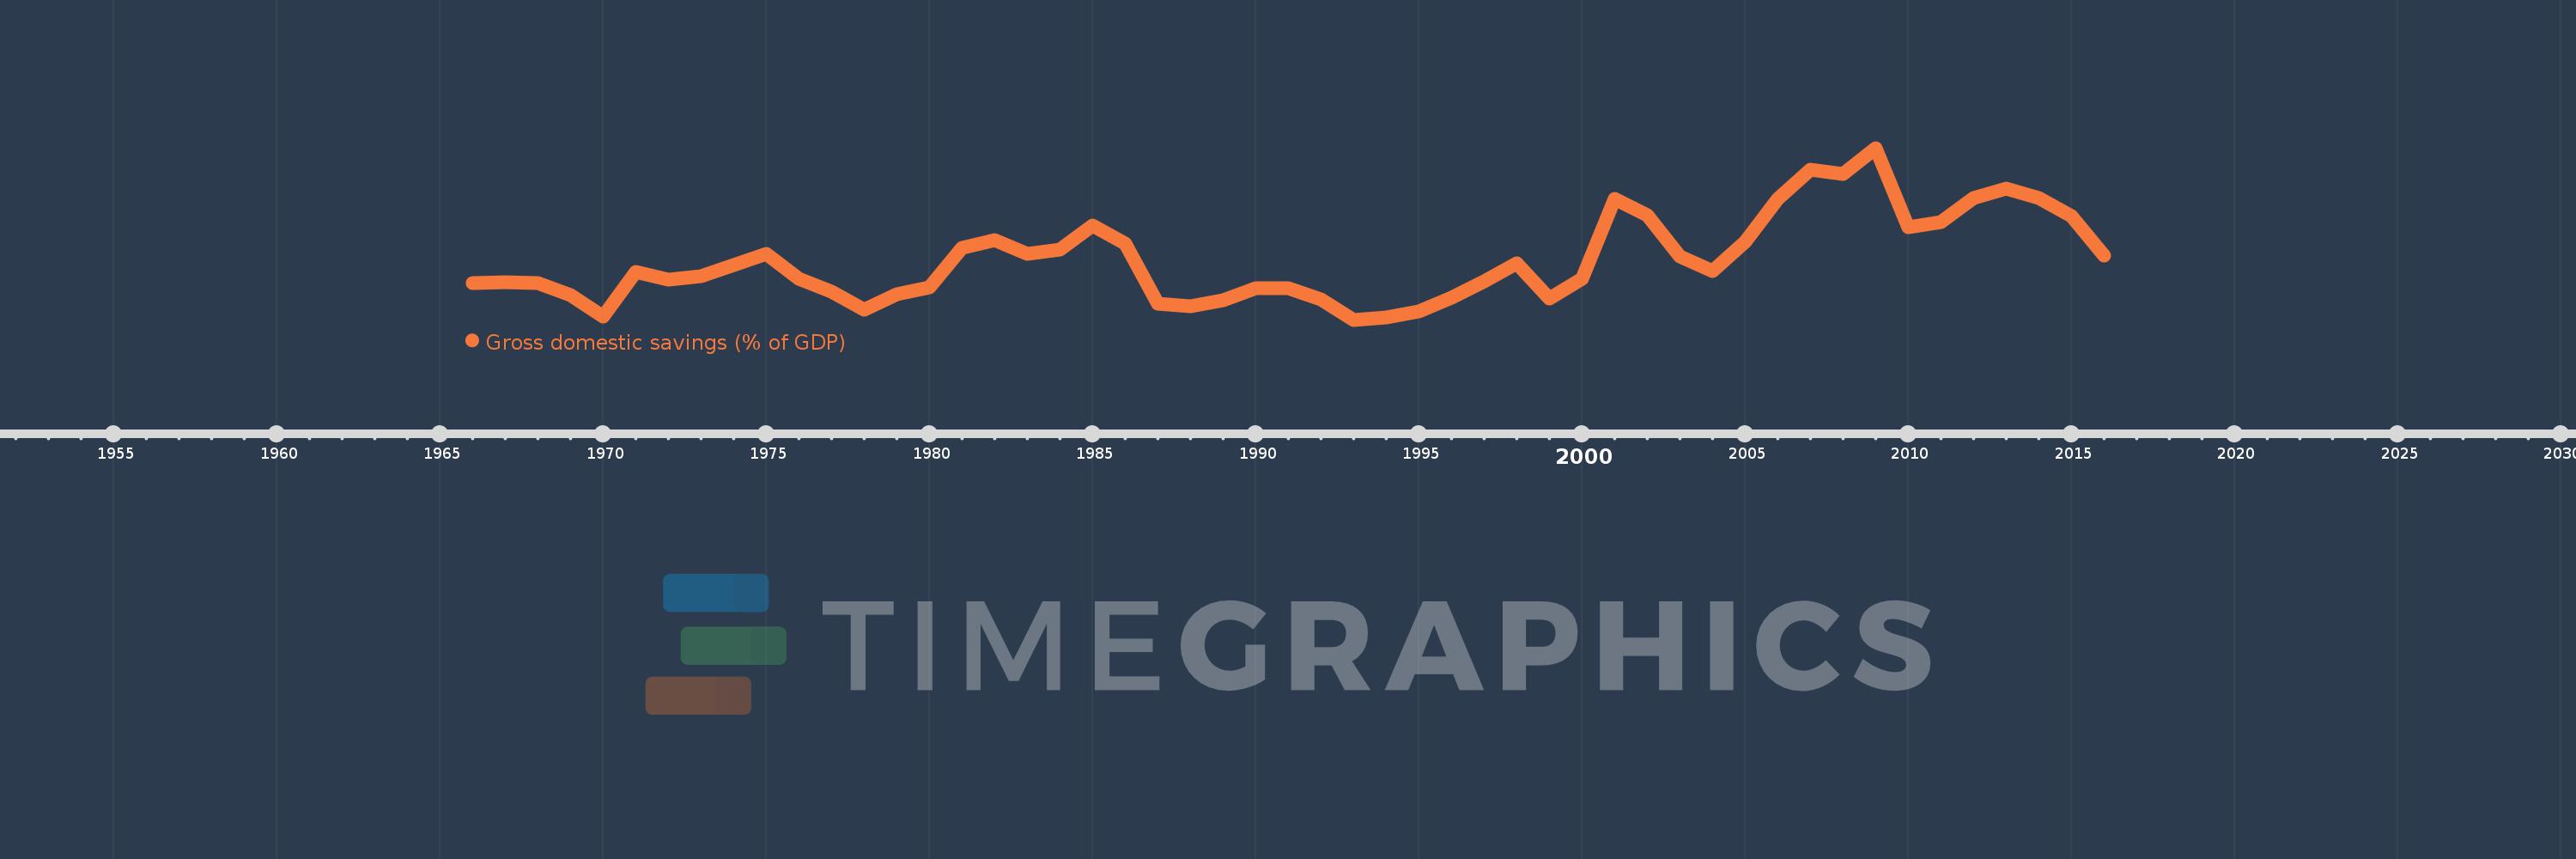
Gross domestic savings (% of GDP)
2016,2015,2014,2013,2012,2011,2010,2009,2008,2007,2006,2005,2004,2003,2002,2001,2000,1999,1998,1997,1996,1995,1994,1993,1992,1991,1990,1989,1988,1987,1986,1985,1984,1983,1982,1981,1980,1979,1978,1977,1976,1975,1974,1973,1972,1971,1970,1969,1968,1967,1966
This statistics in other country:
AfghanistanAlbaniaAlgeriaAngolaAntigua and BarbudaArab WorldArgentinaArmeniaArubaAustraliaAustriaAzerbaijanBahamas, TheBahrainBangladeshBarbadosBelarusBelgiumBelizeBeninBermudaBhutanBoliviaBosnia and HerzegovinaBotswanaBrazilBrunei DarussalamBulgariaBurkina FasoBurundiCabo VerdeCambodiaCameroonCanadaCaribbean small statesCentral African RepublicCentral Europe and the BalticsChadChileChinaColombiaComorosCongo, Dem. Rep.Congo, Rep.Costa RicaCote d'IvoireCroatiaCubaCyprusCzech RepublicDenmarkDjiboutiDominicaDominican RepublicEarly-demographic dividendEast Asia & PacificEast Asia & Pacific (excluding high income)East Asia & Pacific (IDA & IBRD countries)EcuadorEgypt, Arab Rep.El SalvadorEquatorial GuineaEritreaEstoniaEthiopiaEuro areaEurope & Central AsiaEurope & Central Asia (excluding high income)Europe & Central Asia (IDA & IBRD countries)European UnionFaroe IslandsFijiFinlandFragile and conflict affected situationsFranceGabonGambia, TheGeorgiaGermanyGhanaGreeceGrenadaGuatemalaGuineaGuinea-BissauGuyanaHaitiHeavily indebted poor countries (HIPC)High incomeHondurasHong Kong SAR, ChinaHungaryIBRD onlyIcelandIDA & IBRD totalIDA blendIDA onlyIDA totalIndiaIndonesiaIran, Islamic Rep.IraqIrelandIsraelItalyJamaicaJapanJordanKazakhstanKenyaKiribatiKorea, Rep.KosovoKuwaitKyrgyz RepublicLao PDRLate-demographic dividendLatin America & Caribbean Latin America & Caribbean (excluding high income)Latin America & the Caribbean (IDA & IBRD countries)LatviaLeast developed countries: UN classificationLebanonLesothoLiberiaLibyaLithuaniaLow & middle incomeLow incomeLower middle incomeLuxembourgMacao SAR, ChinaMacedonia, FYRMadagascarMalawiMalaysiaMaldivesMaliMaltaMauritaniaMauritiusMexicoMicronesia, Fed. Sts.Middle East & North AfricaMiddle East & North Africa (excluding high income)Middle East & North Africa (IDA & IBRD countries)Middle incomeMoldovaMongoliaMontenegroMoroccoMozambiqueNamibiaNepalNetherlandsNew CaledoniaNew ZealandNicaraguaNigerNigeriaNorth AmericaNorwayOECD membersOmanOther small statesPacific island small statesPakistanPanamaPapua New GuineaParaguayPeruPhilippinesPolandPortugalPost-demographic dividendPre-demographic dividendPuerto RicoQatarRomaniaRussian FederationRwandaSaudi ArabiaSenegalSerbiaSeychellesSierra LeoneSingaporeSlovak RepublicSloveniaSmall statesSolomon IslandsSomaliaSouth AfricaSouth AsiaSouth Asia (IDA & IBRD)South SudanSpainSri LankaSt. Kitts and NevisSt. LuciaSt. Vincent and the GrenadinesSub-Saharan Africa Sub-Saharan Africa (excluding high income)Sub-Saharan Africa (IDA & IBRD countries)SudanSurinameSwazilandSwedenSwitzerlandSyrian Arab RepublicTajikistanTanzaniaThailandTimor-LesteTogoTongaTrinidad and TobagoTunisiaTurkeyTurkmenistanUgandaUkraineUnited Arab EmiratesUnited KingdomUnited StatesUpper middle incomeUruguayUzbekistanVanuatuVenezuela, RBVietnamWest Bank and GazaWorldYemen, Rep.ZambiaZimbabwe Timeline:
This timeline shows a graph from 1966 to 2016 of Norway. No data until 1965. Number of actual observations by date: 51.
Source name:
World Development Indicators
Source organization:
World Bank national accounts data, and OECD National Accounts data files.
Categories, topics:
Economy & Growth
Last updated:
apr 23, 2017
Indicators value changes by year
Minimum:
28.117
jan 1, 1993
Maximum:
42.973
jan 1, 2009
At the date of observation
Value
Absolute change
Change from previous value
jan 1, 1966
31.276
+31.276
0.0%
jan 1, 1967
31.344
+0.068
0.22%
jan 1, 1968
31.317
-0.028
-0.09%
jan 1, 1969
30.217
-1.1
-3.51%
jan 1, 1970
28.416
-1.801
-5.96%
jan 1, 1971
32.283
+3.867
13.61%
jan 1, 1972
31.606
-0.677
-2.1%
jan 1, 1973
31.909
+0.303
0.96%
jan 1, 1974
32.817
+0.907
2.84%
jan 1, 1975
33.817
+1.0
3.05%
jan 1, 1976
31.663
-2.153
-6.37%
jan 1, 1977
30.53
-1.133
-3.58%
jan 1, 1978
29.006
-1.524
-4.99%
jan 1, 1979
30.3
+1.294
4.46%
jan 1, 1980
30.931
+0.631
2.08%
jan 1, 1981
34.313
+3.381
10.93%
jan 1, 1982
34.972
+0.66
1.92%
jan 1, 1983
33.819
-1.154
-3.3%
jan 1, 1984
34.164
+0.346
1.02%
jan 1, 1985
36.27
+2.106
6.16%
jan 1, 1986
34.72
-1.551
-4.28%
jan 1, 1987
29.507
-5.213
-15.01%
jan 1, 1988
29.281
-0.226
-0.77%
jan 1, 1989
29.795
+0.514
1.76%
jan 1, 1990
30.87
+1.074
3.61%
jan 1, 1991
30.833
-0.036
-0.12%
jan 1, 1992
29.902
-0.931
-3.02%
jan 1, 1993
28.117
-1.786
-5.97%
jan 1, 1994
28.292
+0.176
0.62%
jan 1, 1995
28.872
+0.58
2.05%
jan 1, 1996
30.005
+1.133
3.92%
jan 1, 1997
31.427
+1.421
4.74%
jan 1, 1998
32.979
+1.553
4.94%
jan 1, 1999
29.961
-3.018
-9.15%
jan 1, 2000
31.659
+1.698
5.67%
jan 1, 2001
38.551
+6.892
21.77%
jan 1, 2002
37.123
-1.428
-3.7%
jan 1, 2003
33.612
-3.51
-9.46%
jan 1, 2004
32.298
-1.315
-3.91%
jan 1, 2005
34.838
+2.54
7.87%
jan 1, 2006
38.593
+3.755
10.78%
jan 1, 2007
41.112
+2.519
6.53%
jan 1, 2008
40.704
-0.408
-0.99%
jan 1, 2009
42.973
+2.269
5.57%
jan 1, 2010
36.082
-6.891
-16.04%
jan 1, 2011
36.584
+0.502
1.39%
jan 1, 2012
38.678
+2.094
5.72%
jan 1, 2013
39.454
+0.777
2.01%
jan 1, 2014
38.614
-0.84
-2.13%
jan 1, 2015
37.051
-1.564
-4.05%
jan 1, 2016
33.644
-3.406
-9.19%
Ranking of countries by current statistics by years


Comments: