29
/
en
AIzaSyAYiBZKx7MnpbEhh9jyipgxe19OcubqV5w
April 1, 2024
115838
Cuba
CUB
true
2
1
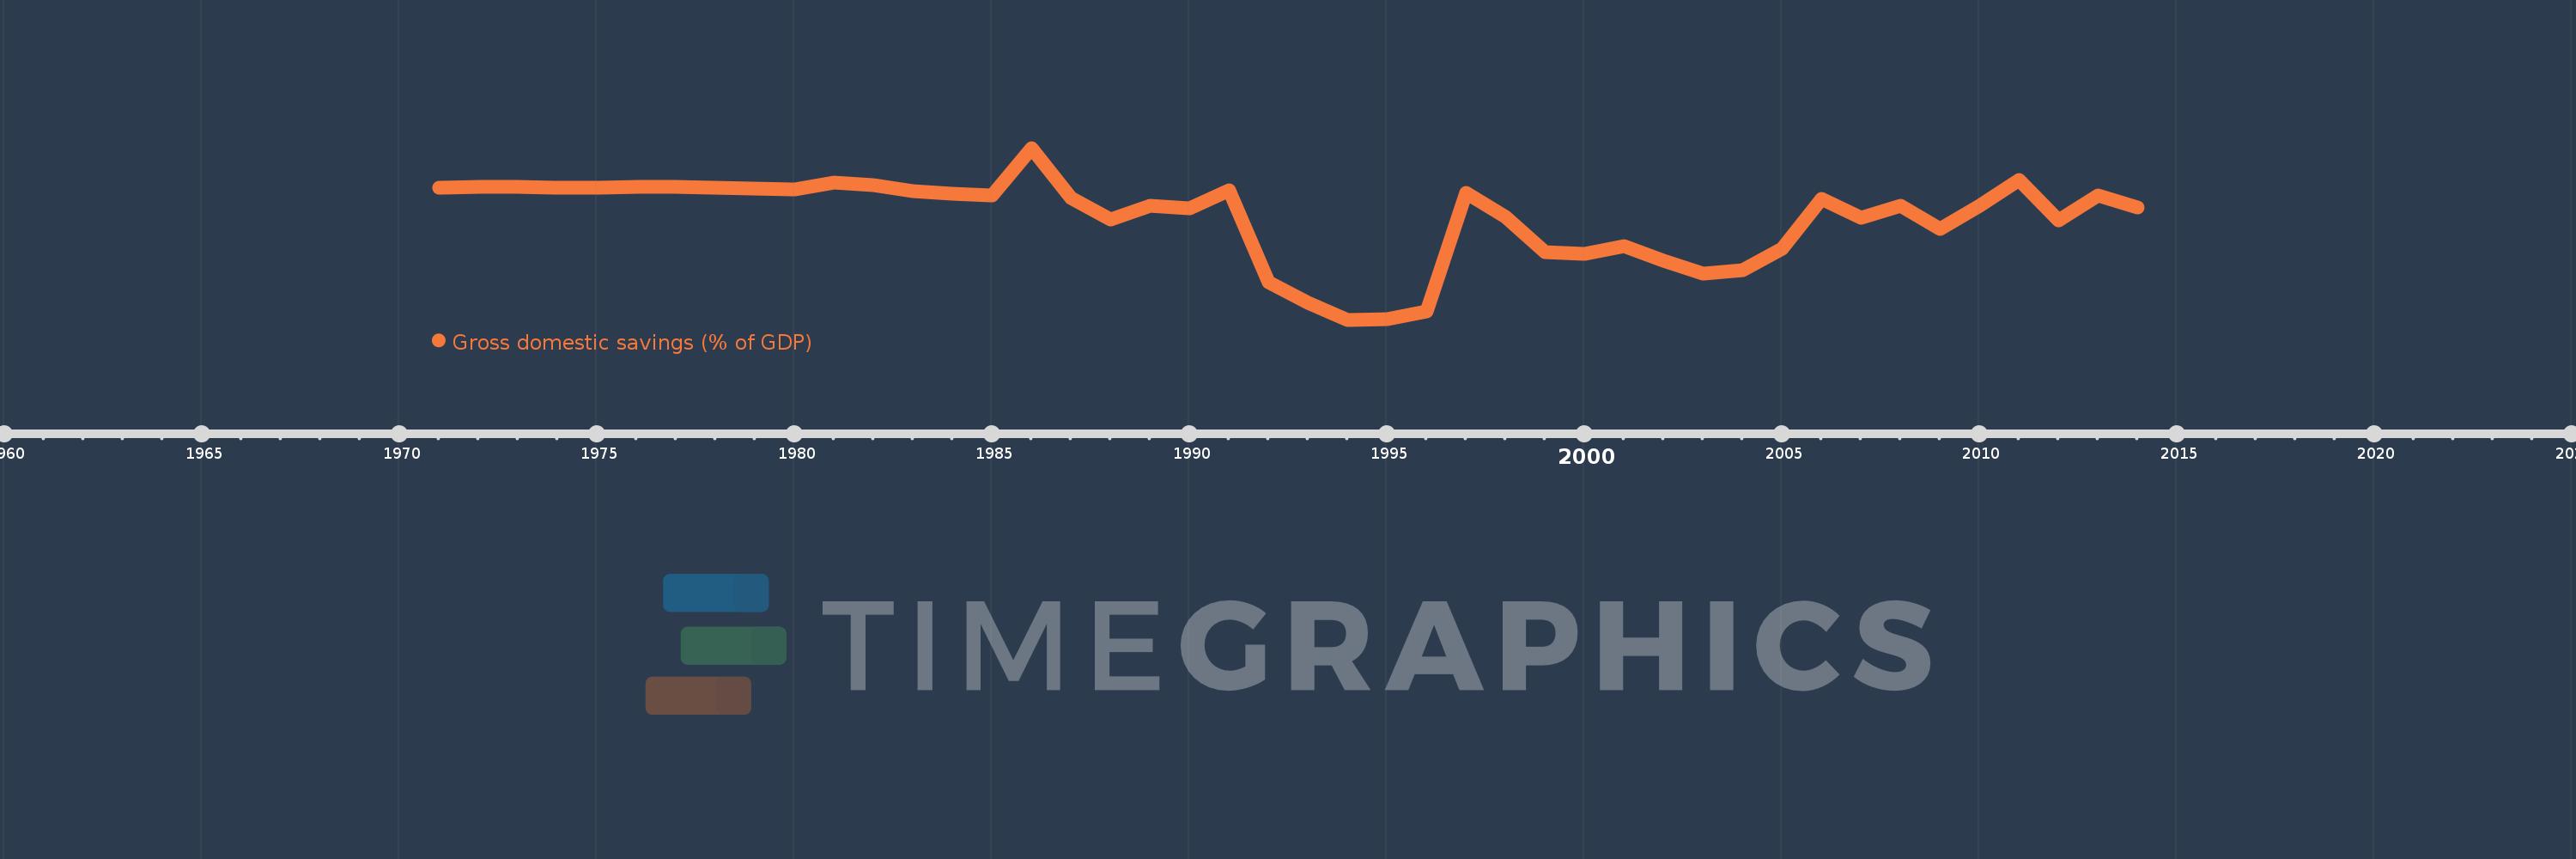
Gross domestic savings (% of GDP)
2014,2013,2012,2011,2010,2009,2008,2007,2006,2005,2004,2003,2002,2001,2000,1999,1998,1997,1996,1995,1994,1993,1992,1991,1990,1989,1988,1987,1986,1985,1984,1983,1982,1981,1980,1979,1978,1977,1976,1975,1974,1973,1972,1971
This statistics in other country:
AfghanistanAlbaniaAlgeriaAngolaAntigua and BarbudaArab WorldArgentinaArmeniaArubaAustraliaAustriaAzerbaijanBahamas, TheBahrainBangladeshBarbadosBelarusBelgiumBelizeBeninBermudaBhutanBoliviaBosnia and HerzegovinaBotswanaBrazilBrunei DarussalamBulgariaBurkina FasoBurundiCabo VerdeCambodiaCameroonCanadaCaribbean small statesCentral African RepublicCentral Europe and the BalticsChadChileChinaColombiaComorosCongo, Dem. Rep.Congo, Rep.Costa RicaCote d'IvoireCroatiaCubaCyprusCzech RepublicDenmarkDjiboutiDominicaDominican RepublicEarly-demographic dividendEast Asia & PacificEast Asia & Pacific (excluding high income)East Asia & Pacific (IDA & IBRD countries)EcuadorEgypt, Arab Rep.El SalvadorEquatorial GuineaEritreaEstoniaEthiopiaEuro areaEurope & Central AsiaEurope & Central Asia (excluding high income)Europe & Central Asia (IDA & IBRD countries)European UnionFaroe IslandsFijiFinlandFragile and conflict affected situationsFranceGabonGambia, TheGeorgiaGermanyGhanaGreeceGrenadaGuatemalaGuineaGuinea-BissauGuyanaHaitiHeavily indebted poor countries (HIPC)High incomeHondurasHong Kong SAR, ChinaHungaryIBRD onlyIcelandIDA & IBRD totalIDA blendIDA onlyIDA totalIndiaIndonesiaIran, Islamic Rep.IraqIrelandIsraelItalyJamaicaJapanJordanKazakhstanKenyaKiribatiKorea, Rep.KosovoKuwaitKyrgyz RepublicLao PDRLate-demographic dividendLatin America & Caribbean Latin America & Caribbean (excluding high income)Latin America & the Caribbean (IDA & IBRD countries)LatviaLeast developed countries: UN classificationLebanonLesothoLiberiaLibyaLithuaniaLow & middle incomeLow incomeLower middle incomeLuxembourgMacao SAR, ChinaMacedonia, FYRMadagascarMalawiMalaysiaMaldivesMaliMaltaMauritaniaMauritiusMexicoMicronesia, Fed. Sts.Middle East & North AfricaMiddle East & North Africa (excluding high income)Middle East & North Africa (IDA & IBRD countries)Middle incomeMoldovaMongoliaMontenegroMoroccoMozambiqueNamibiaNepalNetherlandsNew CaledoniaNew ZealandNicaraguaNigerNigeriaNorth AmericaNorwayOECD membersOmanOther small statesPacific island small statesPakistanPanamaPapua New GuineaParaguayPeruPhilippinesPolandPortugalPost-demographic dividendPre-demographic dividendPuerto RicoQatarRomaniaRussian FederationRwandaSaudi ArabiaSenegalSerbiaSeychellesSierra LeoneSingaporeSlovak RepublicSloveniaSmall statesSolomon IslandsSomaliaSouth AfricaSouth AsiaSouth Asia (IDA & IBRD)South SudanSpainSri LankaSt. Kitts and NevisSt. LuciaSt. Vincent and the GrenadinesSub-Saharan Africa Sub-Saharan Africa (excluding high income)Sub-Saharan Africa (IDA & IBRD countries)SudanSurinameSwazilandSwedenSwitzerlandSyrian Arab RepublicTajikistanTanzaniaThailandTimor-LesteTogoTongaTrinidad and TobagoTunisiaTurkeyTurkmenistanUgandaUkraineUnited Arab EmiratesUnited KingdomUnited StatesUpper middle incomeUruguayUzbekistanVanuatuVenezuela, RBVietnamWest Bank and GazaWorldYemen, Rep.ZambiaZimbabwe Timeline:
This timeline shows a graph from 1971 to 2014 of Cuba. No data until 1970. Number of actual observations by date: 44.
Source name:
World Development Indicators
Source organization:
World Bank national accounts data, and OECD National Accounts data files.
Categories, topics:
Economy & Growth
Last updated:
apr 23, 2017
Indicators value changes by year
Maximum:
17.496
jan 1, 1986
At the date of observation
Value
Absolute change
Change from previous value
jan 1, 1971
14.371
+14.371
0.0%
jan 1, 1972
14.38
+0.009
0.06%
jan 1, 1973
14.378
-0.002
-0.02%
jan 1, 1974
14.363
-0.015
-0.1%
jan 1, 1975
14.334
-0.029
-0.2%
jan 1, 1976
14.402
+0.068
0.47%
jan 1, 1977
14.423
+0.022
0.15%
jan 1, 1978
14.367
-0.057
-0.39%
jan 1, 1979
14.288
-0.079
-0.55%
jan 1, 1980
14.19
-0.098
-0.69%
jan 1, 1981
14.741
+0.551
3.88%
jan 1, 1982
14.533
-0.208
-1.41%
jan 1, 1983
14.083
-0.45
-3.09%
jan 1, 1984
13.893
-0.19
-1.35%
jan 1, 1985
13.698
-0.194
-1.4%
jan 1, 1986
17.496
+3.798
27.73%
jan 1, 1987
13.493
-4.004
-22.88%
jan 1, 1988
11.835
-1.658
-12.29%
jan 1, 1989
12.942
+1.107
9.35%
jan 1, 1990
12.726
-0.216
-1.67%
jan 1, 1991
14.166
+1.44
11.32%
jan 1, 1992
6.862
-7.304
-51.56%
jan 1, 1993
5.235
-1.627
-23.71%
jan 1, 1994
3.867
-1.368
-26.13%
jan 1, 1995
3.946
+0.079
2.03%
jan 1, 1996
4.509
+0.563
14.27%
jan 1, 1997
13.899
+9.39
208.25%
jan 1, 1998
12.046
-1.853
-13.33%
jan 1, 1999
9.204
-2.842
-23.6%
jan 1, 2000
9.062
-0.141
-1.54%
jan 1, 2001
9.689
+0.627
6.92%
jan 1, 2002
8.574
-1.116
-11.51%
jan 1, 2003
7.521
-1.052
-12.27%
jan 1, 2004
7.82
+0.299
3.98%
jan 1, 2005
9.534
+1.714
21.91%
jan 1, 2006
13.448
+3.914
41.06%
jan 1, 2007
11.967
-1.481
-11.01%
jan 1, 2008
12.889
+0.922
7.7%
jan 1, 2009
11.063
-1.826
-14.17%
jan 1, 2010
12.941
+1.879
16.98%
jan 1, 2011
14.924
+1.982
15.32%
jan 1, 2012
11.718
-3.205
-21.48%
jan 1, 2013
13.731
+2.013
17.18%
jan 1, 2014
12.751
-0.98
-7.14%
Ranking of countries by current statistics by years


Comments: