29
/
en
AIzaSyAYiBZKx7MnpbEhh9jyipgxe19OcubqV5w
April 1, 2024
89853
Botswana
BWA
true
2
1
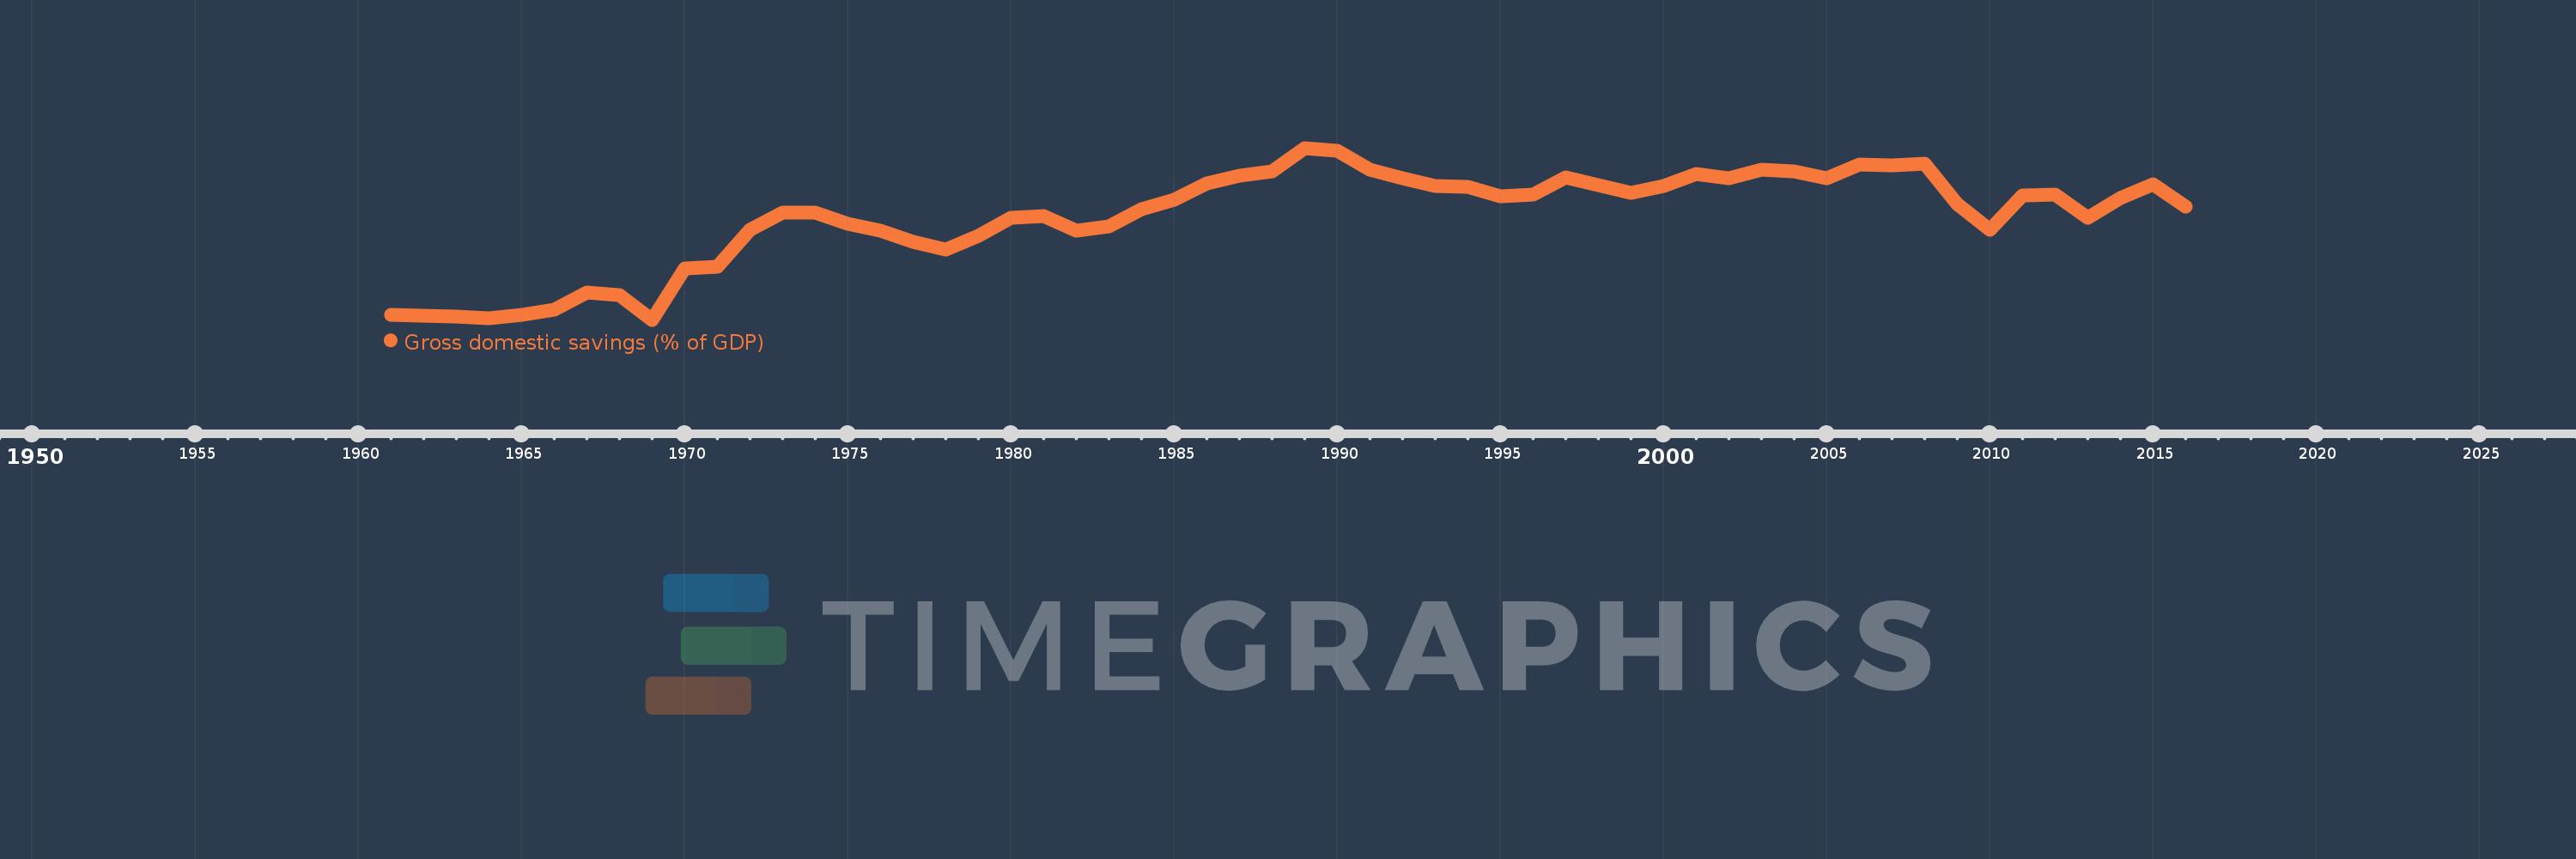
Gross domestic savings (% of GDP)
2016,2015,2014,2013,2012,2011,2010,2009,2008,2007,2006,2005,2004,2003,2002,2001,2000,1999,1998,1997,1996,1995,1994,1993,1992,1991,1990,1989,1988,1987,1986,1985,1984,1983,1982,1981,1980,1979,1978,1977,1976,1975,1974,1973,1972,1971,1970,1969,1968,1967,1966,1965,1964,1963,1962,1961
This statistics in other country:
AfghanistanAlbaniaAlgeriaAngolaAntigua and BarbudaArab WorldArgentinaArmeniaArubaAustraliaAustriaAzerbaijanBahamas, TheBahrainBangladeshBarbadosBelarusBelgiumBelizeBeninBermudaBhutanBoliviaBosnia and HerzegovinaBotswanaBrazilBrunei DarussalamBulgariaBurkina FasoBurundiCabo VerdeCambodiaCameroonCanadaCaribbean small statesCentral African RepublicCentral Europe and the BalticsChadChileChinaColombiaComorosCongo, Dem. Rep.Congo, Rep.Costa RicaCote d'IvoireCroatiaCubaCyprusCzech RepublicDenmarkDjiboutiDominicaDominican RepublicEarly-demographic dividendEast Asia & PacificEast Asia & Pacific (excluding high income)East Asia & Pacific (IDA & IBRD countries)EcuadorEgypt, Arab Rep.El SalvadorEquatorial GuineaEritreaEstoniaEthiopiaEuro areaEurope & Central AsiaEurope & Central Asia (excluding high income)Europe & Central Asia (IDA & IBRD countries)European UnionFaroe IslandsFijiFinlandFragile and conflict affected situationsFranceGabonGambia, TheGeorgiaGermanyGhanaGreeceGrenadaGuatemalaGuineaGuinea-BissauGuyanaHaitiHeavily indebted poor countries (HIPC)High incomeHondurasHong Kong SAR, ChinaHungaryIBRD onlyIcelandIDA & IBRD totalIDA blendIDA onlyIDA totalIndiaIndonesiaIran, Islamic Rep.IraqIrelandIsraelItalyJamaicaJapanJordanKazakhstanKenyaKiribatiKorea, Rep.KosovoKuwaitKyrgyz RepublicLao PDRLate-demographic dividendLatin America & Caribbean Latin America & Caribbean (excluding high income)Latin America & the Caribbean (IDA & IBRD countries)LatviaLeast developed countries: UN classificationLebanonLesothoLiberiaLibyaLithuaniaLow & middle incomeLow incomeLower middle incomeLuxembourgMacao SAR, ChinaMacedonia, FYRMadagascarMalawiMalaysiaMaldivesMaliMaltaMauritaniaMauritiusMexicoMicronesia, Fed. Sts.Middle East & North AfricaMiddle East & North Africa (excluding high income)Middle East & North Africa (IDA & IBRD countries)Middle incomeMoldovaMongoliaMontenegroMoroccoMozambiqueNamibiaNepalNetherlandsNew CaledoniaNew ZealandNicaraguaNigerNigeriaNorth AmericaNorwayOECD membersOmanOther small statesPacific island small statesPakistanPanamaPapua New GuineaParaguayPeruPhilippinesPolandPortugalPost-demographic dividendPre-demographic dividendPuerto RicoQatarRomaniaRussian FederationRwandaSaudi ArabiaSenegalSerbiaSeychellesSierra LeoneSingaporeSlovak RepublicSloveniaSmall statesSolomon IslandsSomaliaSouth AfricaSouth AsiaSouth Asia (IDA & IBRD)South SudanSpainSri LankaSt. Kitts and NevisSt. LuciaSt. Vincent and the GrenadinesSub-Saharan Africa Sub-Saharan Africa (excluding high income)Sub-Saharan Africa (IDA & IBRD countries)SudanSurinameSwazilandSwedenSwitzerlandSyrian Arab RepublicTajikistanTanzaniaThailandTimor-LesteTogoTongaTrinidad and TobagoTunisiaTurkeyTurkmenistanUgandaUkraineUnited Arab EmiratesUnited KingdomUnited StatesUpper middle incomeUruguayUzbekistanVanuatuVenezuela, RBVietnamWest Bank and GazaWorldYemen, Rep.ZambiaZimbabwe Timeline:
This timeline shows a graph from 1961 to 2016 of Botswana. No data until 1960. Number of actual observations by date: 56.
Source name:
World Development Indicators
Source organization:
World Bank national accounts data, and OECD National Accounts data files.
Categories, topics:
Economy & Growth
Last updated:
apr 23, 2017
Indicators value changes by year
Minimum:
-9.158
jan 1, 1969
Maximum:
50.177
jan 1, 1989
At the date of observation
Value
Absolute change
Change from previous value
jan 1, 1961
-7.353
-7.353
0.0%
jan 1, 1962
-7.91
-0.557
7.58%
jan 1, 1963
-8.114
-0.204
2.58%
jan 1, 1964
-8.544
-0.43
5.3%
jan 1, 1965
-7.483
+1.061
-12.42%
jan 1, 1966
-5.64
+1.843
-24.62%
jan 1, 1967
0.136
+5.776
-102.4%
jan 1, 1968
-0.713
-0.849
-626.52%
jan 1, 1969
-9.158
-8.444
1.18K%
jan 1, 1970
8.461
+17.619
-192.39%
jan 1, 1971
9.065
+0.604
7.14%
jan 1, 1972
22.026
+12.962
143.0%
jan 1, 1973
27.773
+5.747
26.09%
jan 1, 1974
27.766
-0.007
-0.03%
jan 1, 1975
24.02
-3.746
-13.49%
jan 1, 1976
21.702
-2.318
-9.65%
jan 1, 1977
17.836
-3.866
-17.81%
jan 1, 1978
15.056
-2.78
-15.59%
jan 1, 1979
19.9
+4.844
32.17%
jan 1, 1980
26.092
+6.193
31.12%
jan 1, 1981
26.669
+0.577
2.21%
jan 1, 1982
21.58
-5.089
-19.08%
jan 1, 1983
22.946
+1.366
6.33%
jan 1, 1984
28.907
+5.961
25.98%
jan 1, 1985
32.293
+3.386
11.71%
jan 1, 1986
38.054
+5.761
17.84%
jan 1, 1987
40.687
+2.634
6.92%
jan 1, 1988
42.188
+1.501
3.69%
jan 1, 1989
50.177
+7.989
18.94%
jan 1, 1990
49.197
-0.98
-1.95%
jan 1, 1991
42.63
-6.566
-13.35%
jan 1, 1992
39.711
-2.92
-6.85%
jan 1, 1993
37.027
-2.684
-6.76%
jan 1, 1994
36.763
-0.264
-0.71%
jan 1, 1995
33.447
-3.316
-9.02%
jan 1, 1996
34.208
+0.761
2.28%
jan 1, 1997
40.145
+5.937
17.36%
jan 1, 1998
37.209
-2.936
-7.31%
jan 1, 1999
34.674
-2.535
-6.81%
jan 1, 2000
37.091
+2.417
6.97%
jan 1, 2001
41.29
+4.199
11.32%
jan 1, 2002
39.678
-1.612
-3.9%
jan 1, 2003
42.673
+2.995
7.55%
jan 1, 2004
41.963
-0.71
-1.66%
jan 1, 2005
39.709
-2.253
-5.37%
jan 1, 2006
44.492
+4.783
12.04%
jan 1, 2007
44.079
-0.413
-0.93%
jan 1, 2008
44.72
+0.641
1.45%
jan 1, 2009
30.819
-13.901
-31.08%
jan 1, 2010
21.846
-8.973
-29.12%
jan 1, 2011
33.783
+11.937
54.64%
jan 1, 2012
34.194
+0.411
1.22%
jan 1, 2013
26.204
-7.99
-23.37%
jan 1, 2014
32.954
+6.75
25.76%
jan 1, 2015
37.678
+4.724
14.33%
jan 1, 2016
29.804
-7.874
-20.9%
Ranking of countries by current statistics by years


Comments: