29
/
en
AIzaSyAYiBZKx7MnpbEhh9jyipgxe19OcubqV5w
April 1, 2024
156038
Indonesia
IDN
true
2
1
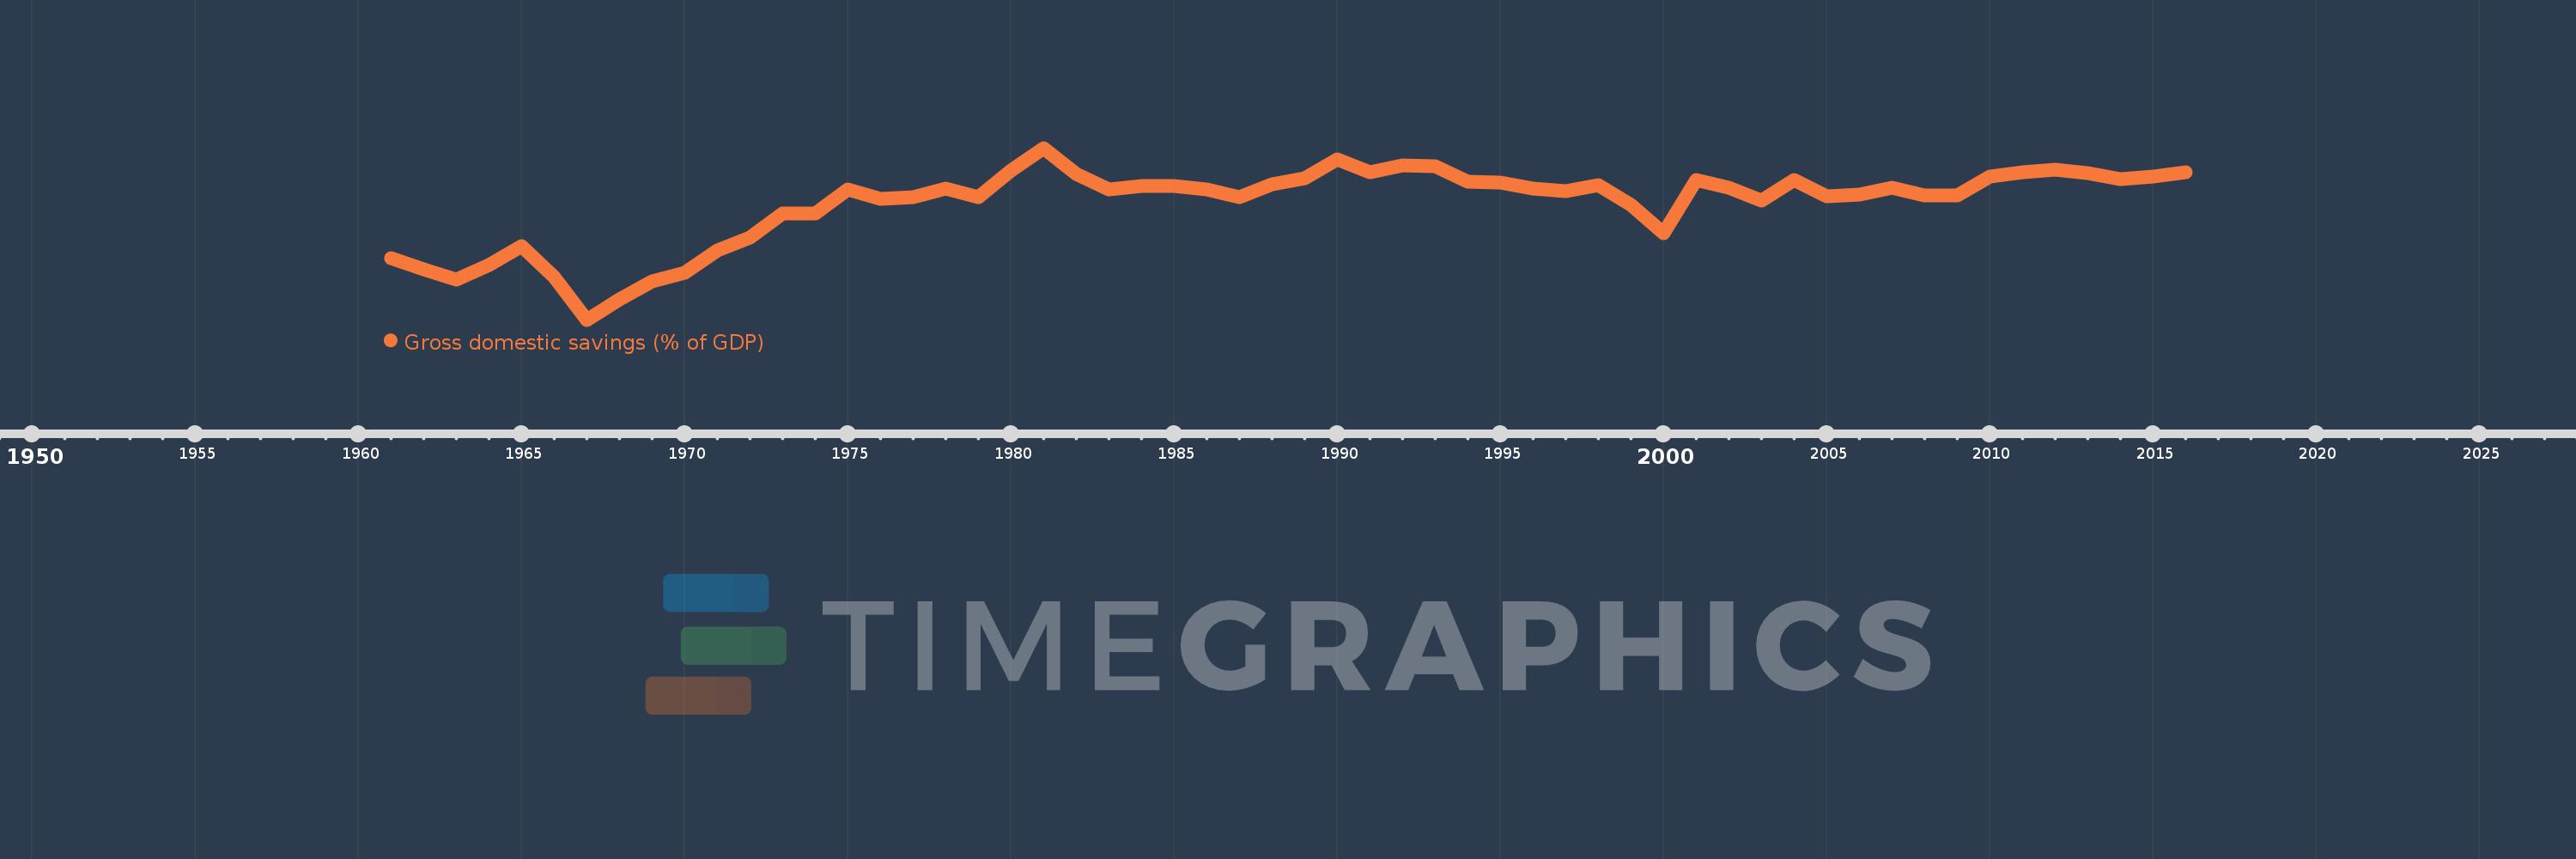
Gross domestic savings (% of GDP)
2016,2015,2014,2013,2012,2011,2010,2009,2008,2007,2006,2005,2004,2003,2002,2001,2000,1999,1998,1997,1996,1995,1994,1993,1992,1991,1990,1989,1988,1987,1986,1985,1984,1983,1982,1981,1980,1979,1978,1977,1976,1975,1974,1973,1972,1971,1970,1969,1968,1967,1966,1965,1964,1963,1962,1961
This statistics in other country:
AfghanistanAlbaniaAlgeriaAngolaAntigua and BarbudaArab WorldArgentinaArmeniaArubaAustraliaAustriaAzerbaijanBahamas, TheBahrainBangladeshBarbadosBelarusBelgiumBelizeBeninBermudaBhutanBoliviaBosnia and HerzegovinaBotswanaBrazilBrunei DarussalamBulgariaBurkina FasoBurundiCabo VerdeCambodiaCameroonCanadaCaribbean small statesCentral African RepublicCentral Europe and the BalticsChadChileChinaColombiaComorosCongo, Dem. Rep.Congo, Rep.Costa RicaCote d'IvoireCroatiaCubaCyprusCzech RepublicDenmarkDjiboutiDominicaDominican RepublicEarly-demographic dividendEast Asia & PacificEast Asia & Pacific (excluding high income)East Asia & Pacific (IDA & IBRD countries)EcuadorEgypt, Arab Rep.El SalvadorEquatorial GuineaEritreaEstoniaEthiopiaEuro areaEurope & Central AsiaEurope & Central Asia (excluding high income)Europe & Central Asia (IDA & IBRD countries)European UnionFaroe IslandsFijiFinlandFragile and conflict affected situationsFranceGabonGambia, TheGeorgiaGermanyGhanaGreeceGrenadaGuatemalaGuineaGuinea-BissauGuyanaHaitiHeavily indebted poor countries (HIPC)High incomeHondurasHong Kong SAR, ChinaHungaryIBRD onlyIcelandIDA & IBRD totalIDA blendIDA onlyIDA totalIndiaIndonesiaIran, Islamic Rep.IraqIrelandIsraelItalyJamaicaJapanJordanKazakhstanKenyaKiribatiKorea, Rep.KosovoKuwaitKyrgyz RepublicLao PDRLate-demographic dividendLatin America & Caribbean Latin America & Caribbean (excluding high income)Latin America & the Caribbean (IDA & IBRD countries)LatviaLeast developed countries: UN classificationLebanonLesothoLiberiaLibyaLithuaniaLow & middle incomeLow incomeLower middle incomeLuxembourgMacao SAR, ChinaMacedonia, FYRMadagascarMalawiMalaysiaMaldivesMaliMaltaMauritaniaMauritiusMexicoMicronesia, Fed. Sts.Middle East & North AfricaMiddle East & North Africa (excluding high income)Middle East & North Africa (IDA & IBRD countries)Middle incomeMoldovaMongoliaMontenegroMoroccoMozambiqueNamibiaNepalNetherlandsNew CaledoniaNew ZealandNicaraguaNigerNigeriaNorth AmericaNorwayOECD membersOmanOther small statesPacific island small statesPakistanPanamaPapua New GuineaParaguayPeruPhilippinesPolandPortugalPost-demographic dividendPre-demographic dividendPuerto RicoQatarRomaniaRussian FederationRwandaSaudi ArabiaSenegalSerbiaSeychellesSierra LeoneSingaporeSlovak RepublicSloveniaSmall statesSolomon IslandsSomaliaSouth AfricaSouth AsiaSouth Asia (IDA & IBRD)South SudanSpainSri LankaSt. Kitts and NevisSt. LuciaSt. Vincent and the GrenadinesSub-Saharan Africa Sub-Saharan Africa (excluding high income)Sub-Saharan Africa (IDA & IBRD countries)SudanSurinameSwazilandSwedenSwitzerlandSyrian Arab RepublicTajikistanTanzaniaThailandTimor-LesteTogoTongaTrinidad and TobagoTunisiaTurkeyTurkmenistanUgandaUkraineUnited Arab EmiratesUnited KingdomUnited StatesUpper middle incomeUruguayUzbekistanVanuatuVenezuela, RBVietnamWest Bank and GazaWorldYemen, Rep.ZambiaZimbabwe Timeline:
This timeline shows a graph from 1961 to 2016 of Indonesia. No data until 1960. Number of actual observations by date: 56.
Source name:
World Development Indicators
Source organization:
World Bank national accounts data, and OECD National Accounts data files.
Categories, topics:
Economy & Growth
Last updated:
apr 23, 2017
Indicators value changes by year
Minimum:
-2.377
jan 1, 1967
Maximum:
40.939
jan 1, 1981
At the date of observation
Value
Absolute change
Change from previous value
jan 1, 1961
13.065
+13.065
0.0%
jan 1, 1962
10.238
-2.828
-21.64%
jan 1, 1963
7.633
-2.605
-25.44%
jan 1, 1964
11.444
+3.811
49.94%
jan 1, 1965
16.286
+4.842
42.31%
jan 1, 1966
8.326
-7.96
-48.88%
jan 1, 1967
-2.377
-10.703
-128.56%
jan 1, 1968
2.71
+5.087
-213.99%
jan 1, 1969
7.288
+4.578
168.94%
jan 1, 1970
9.53
+2.242
30.76%
jan 1, 1971
15.104
+5.574
58.49%
jan 1, 1972
18.307
+3.203
21.2%
jan 1, 1973
24.506
+6.199
33.86%
jan 1, 1974
24.499
-0.007
-0.03%
jan 1, 1975
30.449
+5.95
24.29%
jan 1, 1976
28.123
-2.326
-7.64%
jan 1, 1977
28.608
+0.485
1.73%
jan 1, 1978
30.673
+2.065
7.22%
jan 1, 1979
28.591
-2.082
-6.79%
jan 1, 1980
35.213
+6.621
23.16%
jan 1, 1981
40.939
+5.727
16.26%
jan 1, 1982
34.291
-6.649
-16.24%
jan 1, 1983
30.468
-3.823
-11.15%
jan 1, 1984
31.39
+0.922
3.03%
jan 1, 1985
31.329
-0.061
-0.19%
jan 1, 1986
30.423
-0.907
-2.89%
jan 1, 1987
28.585
-1.838
-6.04%
jan 1, 1988
31.73
+3.145
11.0%
jan 1, 1989
33.209
+1.478
4.66%
jan 1, 1990
38.072
+4.863
14.64%
jan 1, 1991
34.782
-3.29
-8.64%
jan 1, 1992
36.541
+1.759
5.06%
jan 1, 1993
36.305
-0.236
-0.65%
jan 1, 1994
32.465
-3.84
-10.58%
jan 1, 1995
32.203
-0.262
-0.81%
jan 1, 1996
30.594
-1.609
-5.0%
jan 1, 1997
30.076
-0.518
-1.69%
jan 1, 1998
31.476
+1.4
4.66%
jan 1, 1999
26.525
-4.951
-15.73%
jan 1, 2000
19.452
-7.073
-26.67%
jan 1, 2001
32.763
+13.312
68.43%
jan 1, 2002
30.81
-1.953
-5.96%
jan 1, 2003
27.7
-3.11
-10.1%
jan 1, 2004
32.937
+5.237
18.91%
jan 1, 2005
28.728
-4.209
-12.78%
jan 1, 2006
29.228
+0.5
1.74%
jan 1, 2007
30.813
+1.585
5.42%
jan 1, 2008
28.962
-1.85
-6.0%
jan 1, 2009
28.871
-0.091
-0.31%
jan 1, 2010
33.791
+4.92
17.04%
jan 1, 2011
34.777
+0.986
2.92%
jan 1, 2012
35.459
+0.682
1.96%
jan 1, 2013
34.677
-0.782
-2.2%
jan 1, 2014
33.041
-1.636
-4.72%
jan 1, 2015
33.779
+0.738
2.23%
jan 1, 2016
34.808
+1.029
3.05%
Ranking of countries by current statistics by years


Comments: