29
/
en
AIzaSyAYiBZKx7MnpbEhh9jyipgxe19OcubqV5w
April 1, 2024
281024
Venezuela, RB
VEN
true
2
1
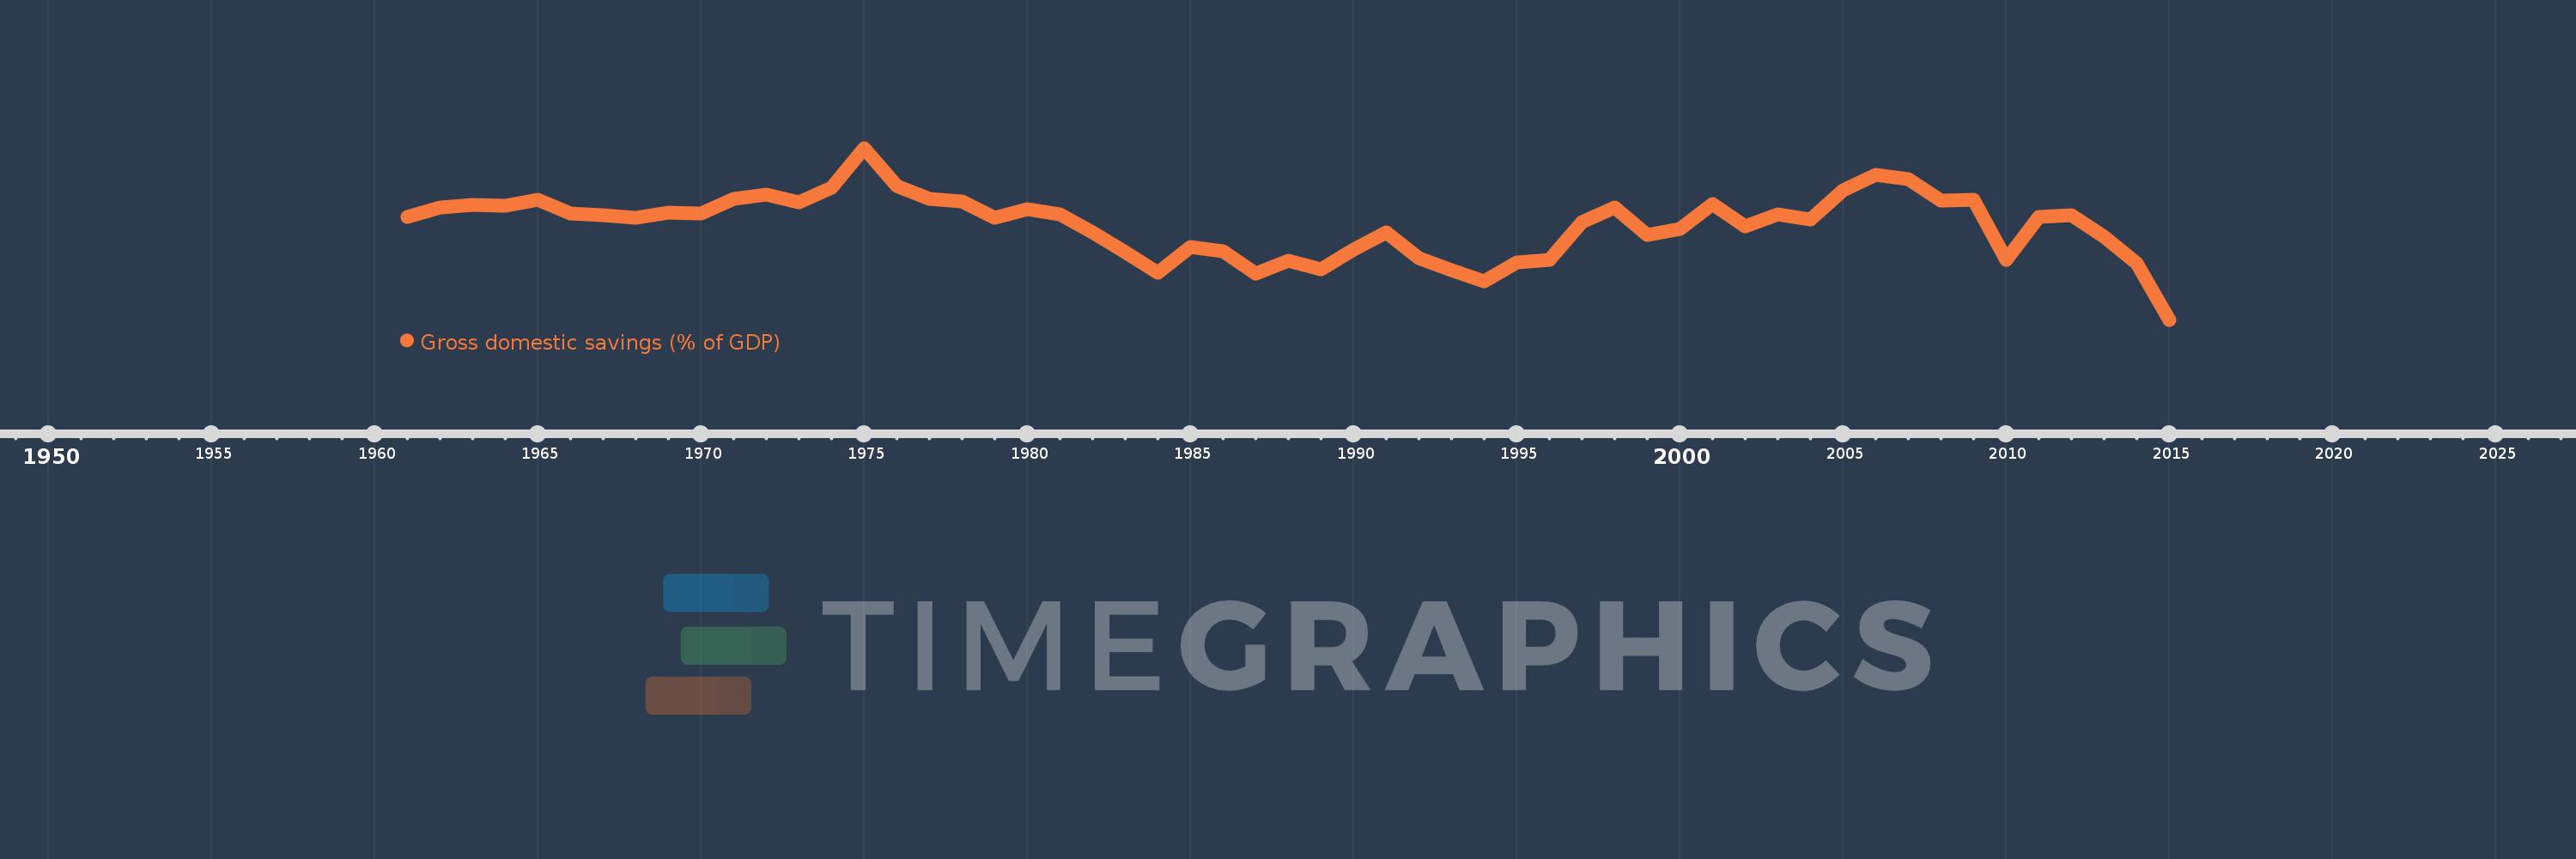
Gross domestic savings (% of GDP)
2015,2014,2013,2012,2011,2010,2009,2008,2007,2006,2005,2004,2003,2002,2001,2000,1999,1998,1997,1996,1995,1994,1993,1992,1991,1990,1989,1988,1987,1986,1985,1984,1983,1982,1981,1980,1979,1978,1977,1976,1975,1974,1973,1972,1971,1970,1969,1968,1967,1966,1965,1964,1963,1962,1961
This statistics in other country:
AfghanistanAlbaniaAlgeriaAngolaAntigua and BarbudaArab WorldArgentinaArmeniaArubaAustraliaAustriaAzerbaijanBahamas, TheBahrainBangladeshBarbadosBelarusBelgiumBelizeBeninBermudaBhutanBoliviaBosnia and HerzegovinaBotswanaBrazilBrunei DarussalamBulgariaBurkina FasoBurundiCabo VerdeCambodiaCameroonCanadaCaribbean small statesCentral African RepublicCentral Europe and the BalticsChadChileChinaColombiaComorosCongo, Dem. Rep.Congo, Rep.Costa RicaCote d'IvoireCroatiaCubaCyprusCzech RepublicDenmarkDjiboutiDominicaDominican RepublicEarly-demographic dividendEast Asia & PacificEast Asia & Pacific (excluding high income)East Asia & Pacific (IDA & IBRD countries)EcuadorEgypt, Arab Rep.El SalvadorEquatorial GuineaEritreaEstoniaEthiopiaEuro areaEurope & Central AsiaEurope & Central Asia (excluding high income)Europe & Central Asia (IDA & IBRD countries)European UnionFaroe IslandsFijiFinlandFragile and conflict affected situationsFranceGabonGambia, TheGeorgiaGermanyGhanaGreeceGrenadaGuatemalaGuineaGuinea-BissauGuyanaHaitiHeavily indebted poor countries (HIPC)High incomeHondurasHong Kong SAR, ChinaHungaryIBRD onlyIcelandIDA & IBRD totalIDA blendIDA onlyIDA totalIndiaIndonesiaIran, Islamic Rep.IraqIrelandIsraelItalyJamaicaJapanJordanKazakhstanKenyaKiribatiKorea, Rep.KosovoKuwaitKyrgyz RepublicLao PDRLate-demographic dividendLatin America & Caribbean Latin America & Caribbean (excluding high income)Latin America & the Caribbean (IDA & IBRD countries)LatviaLeast developed countries: UN classificationLebanonLesothoLiberiaLibyaLithuaniaLow & middle incomeLow incomeLower middle incomeLuxembourgMacao SAR, ChinaMacedonia, FYRMadagascarMalawiMalaysiaMaldivesMaliMaltaMauritaniaMauritiusMexicoMicronesia, Fed. Sts.Middle East & North AfricaMiddle East & North Africa (excluding high income)Middle East & North Africa (IDA & IBRD countries)Middle incomeMoldovaMongoliaMontenegroMoroccoMozambiqueNamibiaNepalNetherlandsNew CaledoniaNew ZealandNicaraguaNigerNigeriaNorth AmericaNorwayOECD membersOmanOther small statesPacific island small statesPakistanPanamaPapua New GuineaParaguayPeruPhilippinesPolandPortugalPost-demographic dividendPre-demographic dividendPuerto RicoQatarRomaniaRussian FederationRwandaSaudi ArabiaSenegalSerbiaSeychellesSierra LeoneSingaporeSlovak RepublicSloveniaSmall statesSolomon IslandsSomaliaSouth AfricaSouth AsiaSouth Asia (IDA & IBRD)South SudanSpainSri LankaSt. Kitts and NevisSt. LuciaSt. Vincent and the GrenadinesSub-Saharan Africa Sub-Saharan Africa (excluding high income)Sub-Saharan Africa (IDA & IBRD countries)SudanSurinameSwazilandSwedenSwitzerlandSyrian Arab RepublicTajikistanTanzaniaThailandTimor-LesteTogoTongaTrinidad and TobagoTunisiaTurkeyTurkmenistanUgandaUkraineUnited Arab EmiratesUnited KingdomUnited StatesUpper middle incomeUruguayUzbekistanVanuatuVenezuela, RBVietnamWest Bank and GazaWorldYemen, Rep.ZambiaZimbabwe Timeline:
This timeline shows a graph from 1961 to 2015 of Venezuela, RB. No data until 1960. Number of actual observations by date: 55.
Source name:
World Development Indicators
Source organization:
World Bank national accounts data, and OECD National Accounts data files.
Categories, topics:
Economy & Growth
Last updated:
apr 23, 2017
Indicators value changes by year
Minimum:
10.107
jan 1, 2015
Maximum:
48.137
jan 1, 1975
At the date of observation
Value
Absolute change
Change from previous value
jan 1, 1961
32.813
+32.813
0.0%
jan 1, 1962
34.874
+2.061
6.28%
jan 1, 1963
35.545
+0.671
1.92%
jan 1, 1964
35.324
-0.221
-0.62%
jan 1, 1965
36.623
+1.299
3.68%
jan 1, 1966
33.65
-2.973
-8.12%
jan 1, 1967
33.233
-0.417
-1.24%
jan 1, 1968
32.724
-0.509
-1.53%
jan 1, 1969
33.839
+1.115
3.41%
jan 1, 1970
33.637
-0.202
-0.6%
jan 1, 1971
36.904
+3.267
9.71%
jan 1, 1972
37.744
+0.841
2.28%
jan 1, 1973
36.05
-1.695
-4.49%
jan 1, 1974
39.306
+3.256
9.03%
jan 1, 1975
48.137
+8.83
22.47%
jan 1, 1976
39.684
-8.453
-17.56%
jan 1, 1977
36.878
-2.806
-7.07%
jan 1, 1978
36.262
-0.616
-1.67%
jan 1, 1979
32.768
-3.494
-9.64%
jan 1, 1980
34.493
+1.725
5.26%
jan 1, 1981
33.345
-1.148
-3.33%
jan 1, 1982
29.352
-3.992
-11.97%
jan 1, 1983
25.073
-4.279
-14.58%
jan 1, 1984
20.516
-4.558
-18.18%
jan 1, 1985
26.153
+5.637
27.48%
jan 1, 1986
25.201
-0.952
-3.64%
jan 1, 1987
20.384
-4.817
-19.12%
jan 1, 1988
23.251
+2.867
14.07%
jan 1, 1989
21.224
-2.027
-8.72%
jan 1, 1990
25.736
+4.512
21.26%
jan 1, 1991
29.486
+3.75
14.57%
jan 1, 1992
23.804
-5.681
-19.27%
jan 1, 1993
21.166
-2.639
-11.09%
jan 1, 1994
18.528
-2.637
-12.46%
jan 1, 1995
22.72
+4.192
22.63%
jan 1, 1996
23.405
+0.685
3.01%
jan 1, 1997
31.742
+8.337
35.62%
jan 1, 1998
34.946
+3.204
10.09%
jan 1, 1999
28.902
-6.044
-17.29%
jan 1, 2000
30.27
+1.368
4.73%
jan 1, 2001
35.802
+5.532
18.27%
jan 1, 2002
30.854
-4.947
-13.82%
jan 1, 2003
33.45
+2.596
8.41%
jan 1, 2004
32.347
-1.103
-3.3%
jan 1, 2005
38.828
+6.481
20.03%
jan 1, 2006
42.194
+3.366
8.67%
jan 1, 2007
41.294
-0.9
-2.13%
jan 1, 2008
36.402
-4.892
-11.85%
jan 1, 2009
36.64
+0.238
0.65%
jan 1, 2010
23.419
-13.221
-36.08%
jan 1, 2011
32.896
+9.477
40.47%
jan 1, 2012
33.32
+0.425
1.29%
jan 1, 2013
28.535
-4.785
-14.36%
jan 1, 2014
22.521
-6.014
-21.08%
jan 1, 2015
10.107
-12.414
-55.12%
Ranking of countries by current statistics by years


Comments: