29
/
en
AIzaSyAYiBZKx7MnpbEhh9jyipgxe19OcubqV5w
April 1, 2024
195600
Mexico
MEX
true
2
1
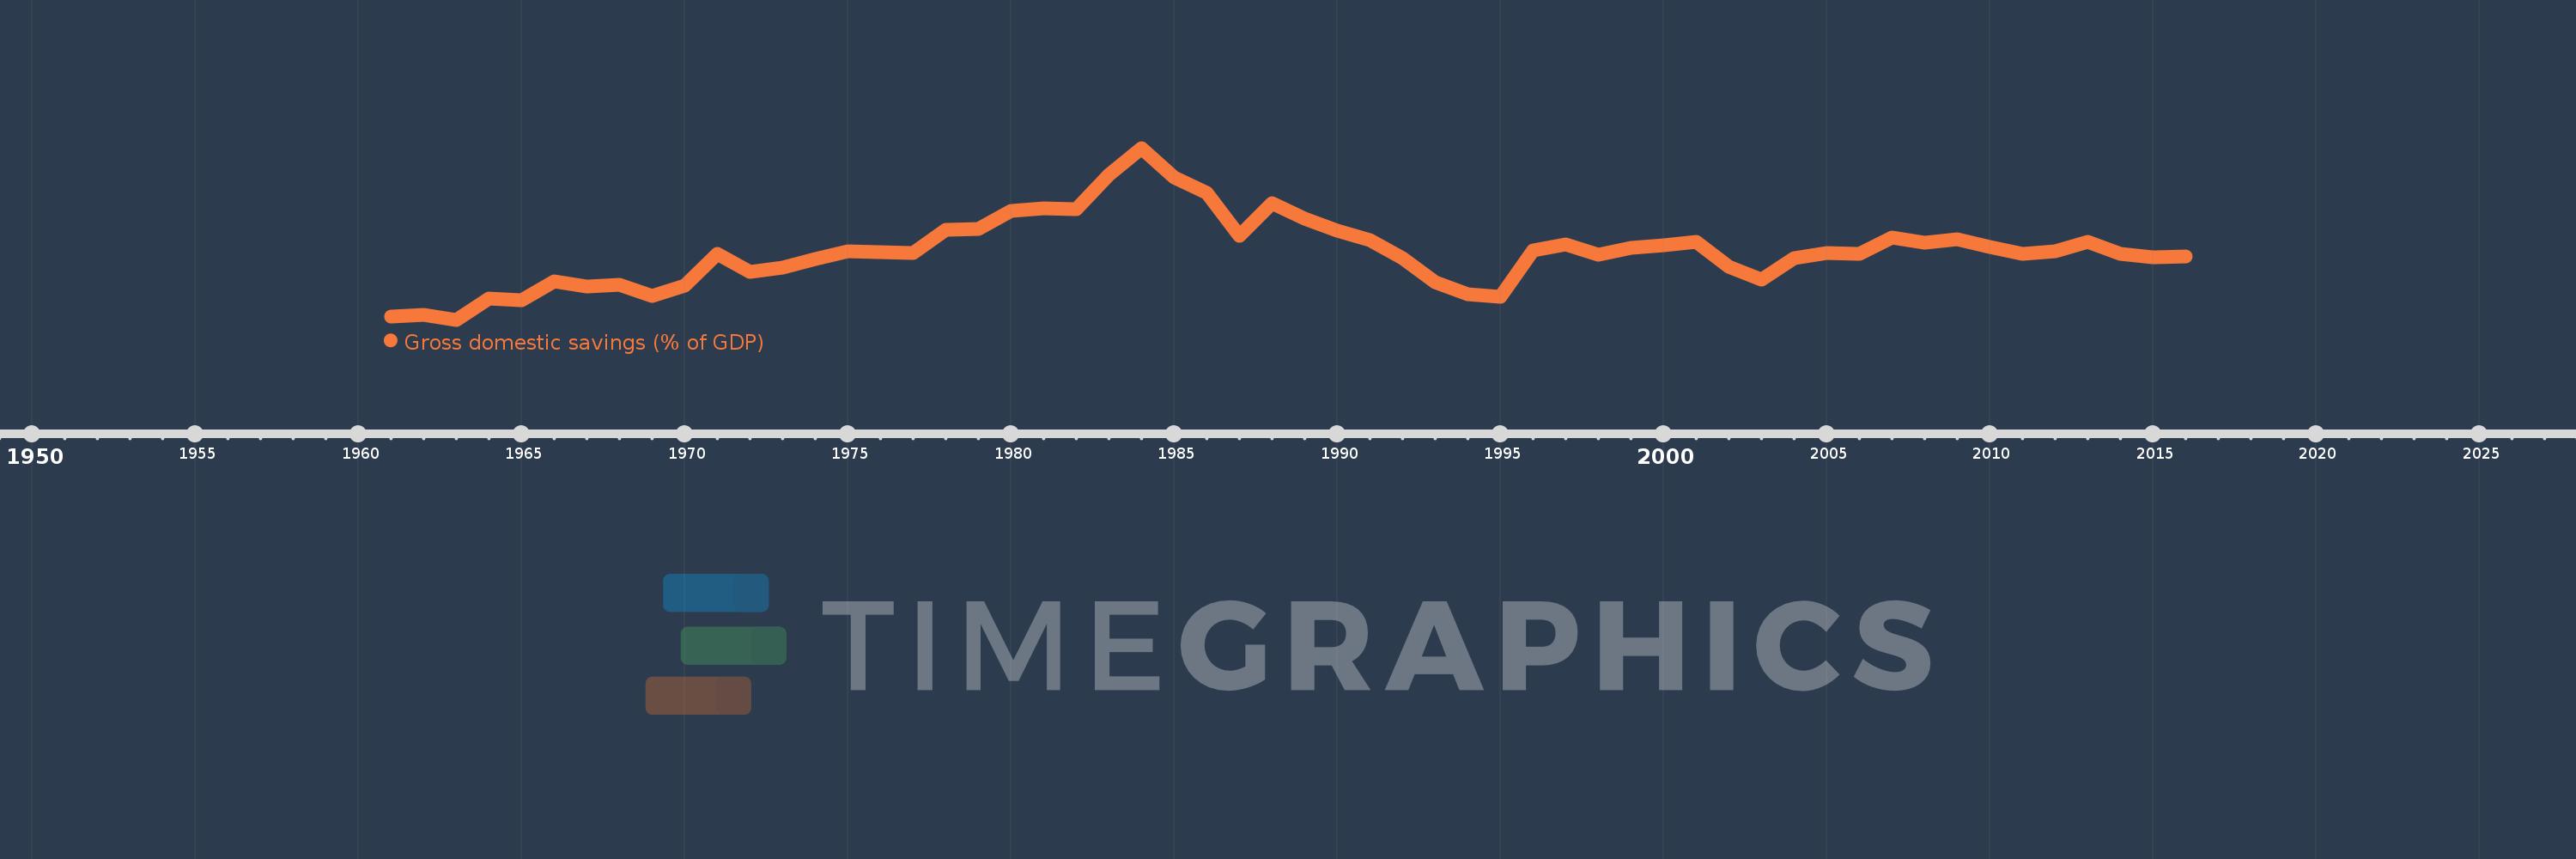
Gross domestic savings (% of GDP)
2016,2015,2014,2013,2012,2011,2010,2009,2008,2007,2006,2005,2004,2003,2002,2001,2000,1999,1998,1997,1996,1995,1994,1993,1992,1991,1990,1989,1988,1987,1986,1985,1984,1983,1982,1981,1980,1979,1978,1977,1976,1975,1974,1973,1972,1971,1970,1969,1968,1967,1966,1965,1964,1963,1962,1961
This statistics in other country:
AfghanistanAlbaniaAlgeriaAngolaAntigua and BarbudaArab WorldArgentinaArmeniaArubaAustraliaAustriaAzerbaijanBahamas, TheBahrainBangladeshBarbadosBelarusBelgiumBelizeBeninBermudaBhutanBoliviaBosnia and HerzegovinaBotswanaBrazilBrunei DarussalamBulgariaBurkina FasoBurundiCabo VerdeCambodiaCameroonCanadaCaribbean small statesCentral African RepublicCentral Europe and the BalticsChadChileChinaColombiaComorosCongo, Dem. Rep.Congo, Rep.Costa RicaCote d'IvoireCroatiaCubaCyprusCzech RepublicDenmarkDjiboutiDominicaDominican RepublicEarly-demographic dividendEast Asia & PacificEast Asia & Pacific (excluding high income)East Asia & Pacific (IDA & IBRD countries)EcuadorEgypt, Arab Rep.El SalvadorEquatorial GuineaEritreaEstoniaEthiopiaEuro areaEurope & Central AsiaEurope & Central Asia (excluding high income)Europe & Central Asia (IDA & IBRD countries)European UnionFaroe IslandsFijiFinlandFragile and conflict affected situationsFranceGabonGambia, TheGeorgiaGermanyGhanaGreeceGrenadaGuatemalaGuineaGuinea-BissauGuyanaHaitiHeavily indebted poor countries (HIPC)High incomeHondurasHong Kong SAR, ChinaHungaryIBRD onlyIcelandIDA & IBRD totalIDA blendIDA onlyIDA totalIndiaIndonesiaIran, Islamic Rep.IraqIrelandIsraelItalyJamaicaJapanJordanKazakhstanKenyaKiribatiKorea, Rep.KosovoKuwaitKyrgyz RepublicLao PDRLate-demographic dividendLatin America & Caribbean Latin America & Caribbean (excluding high income)Latin America & the Caribbean (IDA & IBRD countries)LatviaLeast developed countries: UN classificationLebanonLesothoLiberiaLibyaLithuaniaLow & middle incomeLow incomeLower middle incomeLuxembourgMacao SAR, ChinaMacedonia, FYRMadagascarMalawiMalaysiaMaldivesMaliMaltaMauritaniaMauritiusMexicoMicronesia, Fed. Sts.Middle East & North AfricaMiddle East & North Africa (excluding high income)Middle East & North Africa (IDA & IBRD countries)Middle incomeMoldovaMongoliaMontenegroMoroccoMozambiqueNamibiaNepalNetherlandsNew CaledoniaNew ZealandNicaraguaNigerNigeriaNorth AmericaNorwayOECD membersOmanOther small statesPacific island small statesPakistanPanamaPapua New GuineaParaguayPeruPhilippinesPolandPortugalPost-demographic dividendPre-demographic dividendPuerto RicoQatarRomaniaRussian FederationRwandaSaudi ArabiaSenegalSerbiaSeychellesSierra LeoneSingaporeSlovak RepublicSloveniaSmall statesSolomon IslandsSomaliaSouth AfricaSouth AsiaSouth Asia (IDA & IBRD)South SudanSpainSri LankaSt. Kitts and NevisSt. LuciaSt. Vincent and the GrenadinesSub-Saharan Africa Sub-Saharan Africa (excluding high income)Sub-Saharan Africa (IDA & IBRD countries)SudanSurinameSwazilandSwedenSwitzerlandSyrian Arab RepublicTajikistanTanzaniaThailandTimor-LesteTogoTongaTrinidad and TobagoTunisiaTurkeyTurkmenistanUgandaUkraineUnited Arab EmiratesUnited KingdomUnited StatesUpper middle incomeUruguayUzbekistanVanuatuVenezuela, RBVietnamWest Bank and GazaWorldYemen, Rep.ZambiaZimbabwe Timeline:
This timeline shows a graph from 1961 to 2016 of Mexico. No data until 1960. Number of actual observations by date: 56.
Source name:
World Development Indicators
Source organization:
World Bank national accounts data, and OECD National Accounts data files.
Categories, topics:
Economy & Growth
Last updated:
apr 23, 2017
Indicators value changes by year
Minimum:
14.895
jan 1, 1963
Maximum:
30.332
jan 1, 1984
At the date of observation
Value
Absolute change
Change from previous value
jan 1, 1961
15.192
+15.192
0.0%
jan 1, 1962
15.368
+0.176
1.16%
jan 1, 1963
14.895
-0.473
-3.08%
jan 1, 1964
16.763
+1.869
12.55%
jan 1, 1965
16.652
-0.111
-0.66%
jan 1, 1966
18.381
+1.729
10.38%
jan 1, 1967
17.901
-0.48
-2.61%
jan 1, 1968
18.017
+0.116
0.65%
jan 1, 1969
17.071
-0.946
-5.25%
jan 1, 1970
17.921
+0.849
4.97%
jan 1, 1971
20.823
+2.903
16.2%
jan 1, 1972
19.162
-1.661
-7.98%
jan 1, 1973
19.553
+0.391
2.04%
jan 1, 1974
20.333
+0.78
3.99%
jan 1, 1975
21.015
+0.683
3.36%
jan 1, 1976
20.966
-0.05
-0.24%
jan 1, 1977
20.912
-0.054
-0.26%
jan 1, 1978
22.939
+2.028
9.7%
jan 1, 1979
23.033
+0.093
0.41%
jan 1, 1980
24.689
+1.656
7.19%
jan 1, 1981
24.889
+0.2
0.81%
jan 1, 1982
24.857
-0.032
-0.13%
jan 1, 1983
27.927
+3.07
12.35%
jan 1, 1984
30.332
+2.405
8.61%
jan 1, 1985
27.689
-2.643
-8.71%
jan 1, 1986
26.257
-1.433
-5.17%
jan 1, 1987
22.445
-3.812
-14.52%
jan 1, 1988
25.373
+2.928
13.05%
jan 1, 1989
23.951
-1.422
-5.6%
jan 1, 1990
22.878
-1.073
-4.48%
jan 1, 1991
22.037
-0.841
-3.68%
jan 1, 1992
20.421
-1.616
-7.33%
jan 1, 1993
18.258
-2.163
-10.59%
jan 1, 1994
17.189
-1.069
-5.86%
jan 1, 1995
16.955
-0.233
-1.36%
jan 1, 1996
21.162
+4.206
24.81%
jan 1, 1997
21.696
+0.534
2.52%
jan 1, 1998
20.721
-0.974
-4.49%
jan 1, 1999
21.374
+0.653
3.15%
jan 1, 2000
21.616
+0.242
1.13%
jan 1, 2001
21.928
+0.312
1.44%
jan 1, 2002
19.69
-2.238
-10.21%
jan 1, 2003
18.528
-1.162
-5.9%
jan 1, 2004
20.444
+1.915
10.34%
jan 1, 2005
20.896
+0.453
2.21%
jan 1, 2006
20.83
-0.066
-0.32%
jan 1, 2007
22.255
+1.424
6.84%
jan 1, 2008
21.808
-0.446
-2.0%
jan 1, 2009
22.162
+0.353
1.62%
jan 1, 2010
21.433
-0.729
-3.29%
jan 1, 2011
20.853
-0.58
-2.71%
jan 1, 2012
21.012
+0.159
0.76%
jan 1, 2013
21.933
+0.92
4.38%
jan 1, 2014
20.783
-1.15
-5.24%
jan 1, 2015
20.478
-0.305
-1.47%
jan 1, 2016
20.614
+0.136
0.67%
Ranking of countries by current statistics by years


Comments: