29
/
en
AIzaSyAYiBZKx7MnpbEhh9jyipgxe19OcubqV5w
April 1, 2024
69860
Argentina
ARG
true
2
1
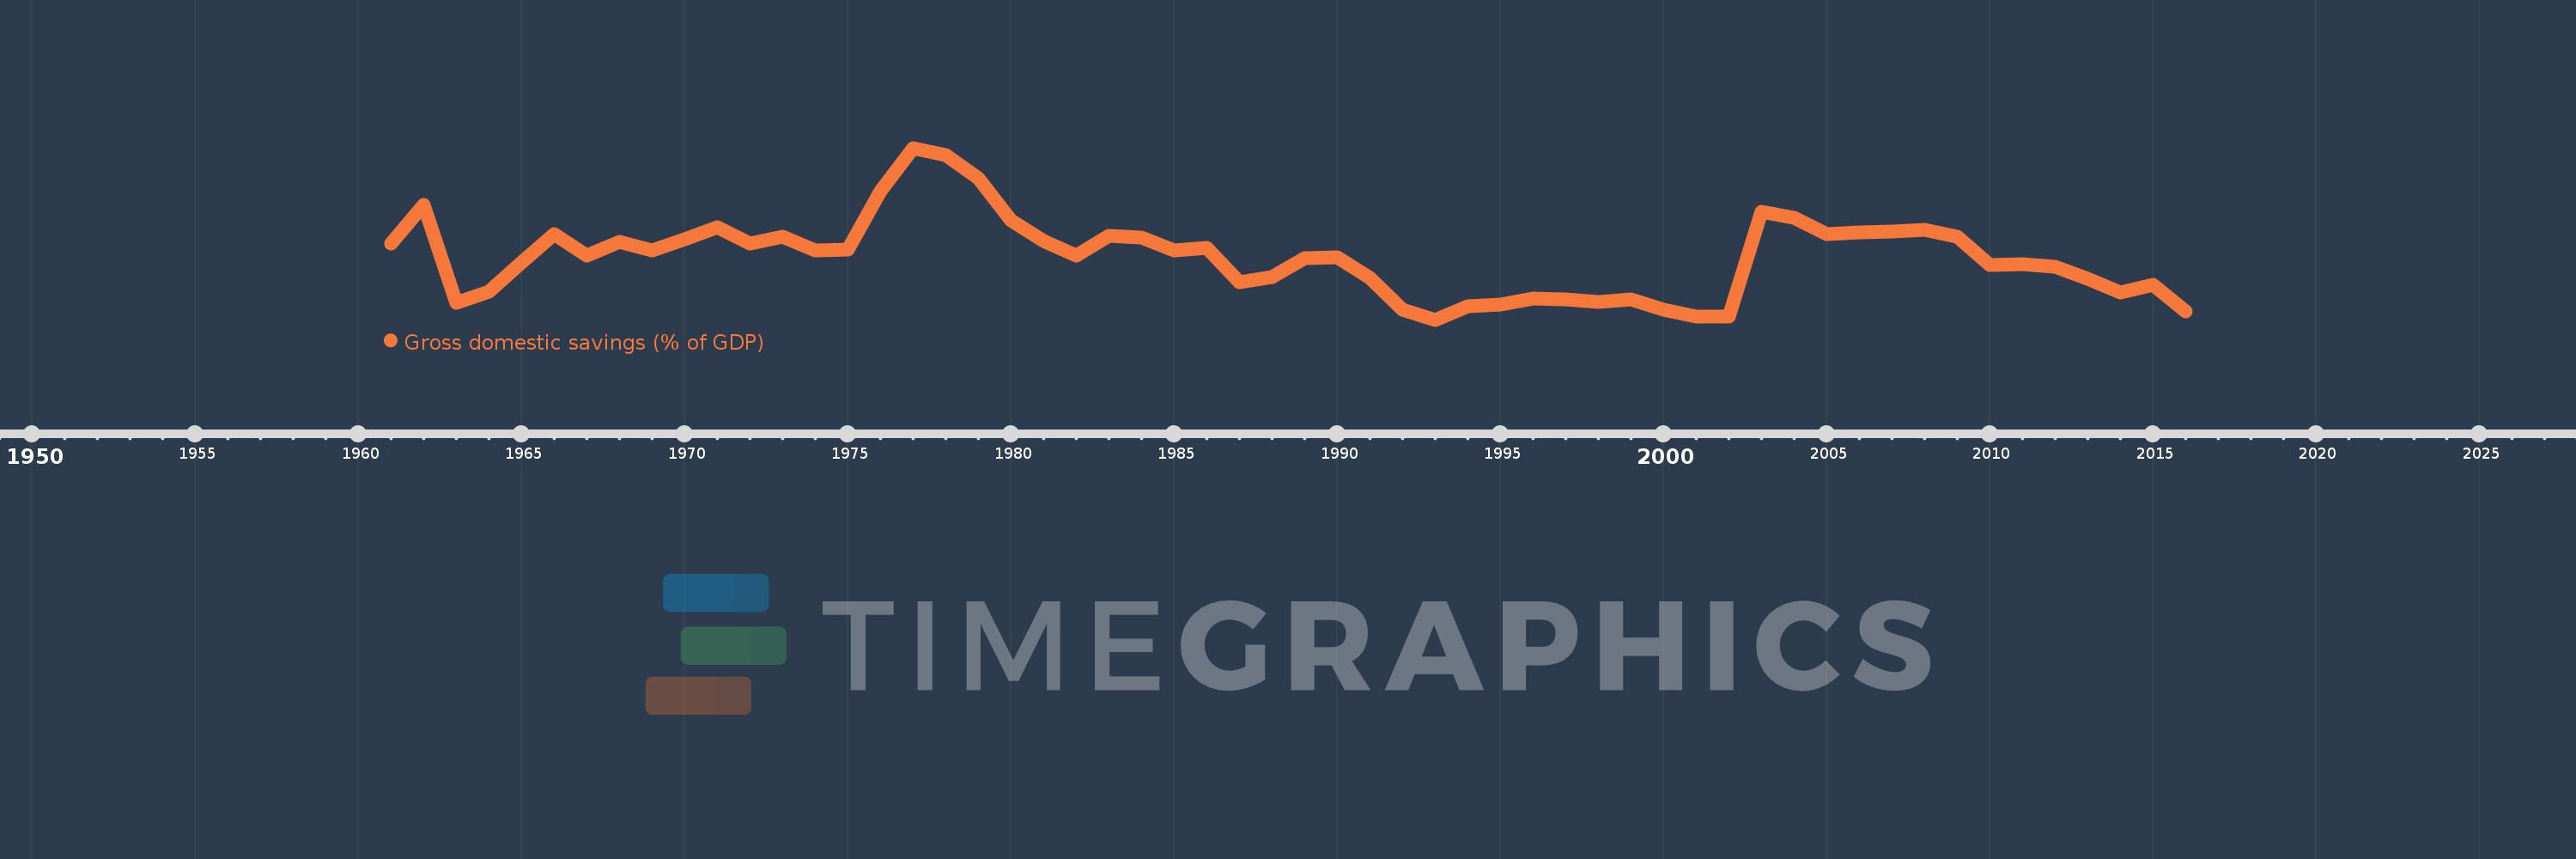
Gross domestic savings (% of GDP)
2016,2015,2014,2013,2012,2011,2010,2009,2008,2007,2006,2005,2004,2003,2002,2001,2000,1999,1998,1997,1996,1995,1994,1993,1992,1991,1990,1989,1988,1987,1986,1985,1984,1983,1982,1981,1980,1979,1978,1977,1976,1975,1974,1973,1972,1971,1970,1969,1968,1967,1966,1965,1964,1963,1962,1961
This statistics in other country:
AfghanistanAlbaniaAlgeriaAngolaAntigua and BarbudaArab WorldArgentinaArmeniaArubaAustraliaAustriaAzerbaijanBahamas, TheBahrainBangladeshBarbadosBelarusBelgiumBelizeBeninBermudaBhutanBoliviaBosnia and HerzegovinaBotswanaBrazilBrunei DarussalamBulgariaBurkina FasoBurundiCabo VerdeCambodiaCameroonCanadaCaribbean small statesCentral African RepublicCentral Europe and the BalticsChadChileChinaColombiaComorosCongo, Dem. Rep.Congo, Rep.Costa RicaCote d'IvoireCroatiaCubaCyprusCzech RepublicDenmarkDjiboutiDominicaDominican RepublicEarly-demographic dividendEast Asia & PacificEast Asia & Pacific (excluding high income)East Asia & Pacific (IDA & IBRD countries)EcuadorEgypt, Arab Rep.El SalvadorEquatorial GuineaEritreaEstoniaEthiopiaEuro areaEurope & Central AsiaEurope & Central Asia (excluding high income)Europe & Central Asia (IDA & IBRD countries)European UnionFaroe IslandsFijiFinlandFragile and conflict affected situationsFranceGabonGambia, TheGeorgiaGermanyGhanaGreeceGrenadaGuatemalaGuineaGuinea-BissauGuyanaHaitiHeavily indebted poor countries (HIPC)High incomeHondurasHong Kong SAR, ChinaHungaryIBRD onlyIcelandIDA & IBRD totalIDA blendIDA onlyIDA totalIndiaIndonesiaIran, Islamic Rep.IraqIrelandIsraelItalyJamaicaJapanJordanKazakhstanKenyaKiribatiKorea, Rep.KosovoKuwaitKyrgyz RepublicLao PDRLate-demographic dividendLatin America & Caribbean Latin America & Caribbean (excluding high income)Latin America & the Caribbean (IDA & IBRD countries)LatviaLeast developed countries: UN classificationLebanonLesothoLiberiaLibyaLithuaniaLow & middle incomeLow incomeLower middle incomeLuxembourgMacao SAR, ChinaMacedonia, FYRMadagascarMalawiMalaysiaMaldivesMaliMaltaMauritaniaMauritiusMexicoMicronesia, Fed. Sts.Middle East & North AfricaMiddle East & North Africa (excluding high income)Middle East & North Africa (IDA & IBRD countries)Middle incomeMoldovaMongoliaMontenegroMoroccoMozambiqueNamibiaNepalNetherlandsNew CaledoniaNew ZealandNicaraguaNigerNigeriaNorth AmericaNorwayOECD membersOmanOther small statesPacific island small statesPakistanPanamaPapua New GuineaParaguayPeruPhilippinesPolandPortugalPost-demographic dividendPre-demographic dividendPuerto RicoQatarRomaniaRussian FederationRwandaSaudi ArabiaSenegalSerbiaSeychellesSierra LeoneSingaporeSlovak RepublicSloveniaSmall statesSolomon IslandsSomaliaSouth AfricaSouth AsiaSouth Asia (IDA & IBRD)South SudanSpainSri LankaSt. Kitts and NevisSt. LuciaSt. Vincent and the GrenadinesSub-Saharan Africa Sub-Saharan Africa (excluding high income)Sub-Saharan Africa (IDA & IBRD countries)SudanSurinameSwazilandSwedenSwitzerlandSyrian Arab RepublicTajikistanTanzaniaThailandTimor-LesteTogoTongaTrinidad and TobagoTunisiaTurkeyTurkmenistanUgandaUkraineUnited Arab EmiratesUnited KingdomUnited StatesUpper middle incomeUruguayUzbekistanVanuatuVenezuela, RBVietnamWest Bank and GazaWorldYemen, Rep.ZambiaZimbabwe Timeline:
This timeline shows a graph from 1961 to 2016 of Argentina. No data until 1960. Number of actual observations by date: 56.
Source name:
World Development Indicators
Source organization:
World Bank national accounts data, and OECD National Accounts data files.
Categories, topics:
Economy & Growth
Last updated:
apr 23, 2017
Indicators value changes by year
Minimum:
15.168
jan 1, 1993
Maximum:
33.983
jan 1, 1977
At the date of observation
Value
Absolute change
Change from previous value
jan 1, 1961
23.479
+23.479
0.0%
jan 1, 1962
27.766
+4.287
18.26%
jan 1, 1963
17.039
-10.727
-38.63%
jan 1, 1964
18.273
+1.234
7.24%
jan 1, 1965
21.474
+3.201
17.52%
jan 1, 1966
24.503
+3.029
14.11%
jan 1, 1967
22.206
-2.297
-9.38%
jan 1, 1968
23.714
+1.508
6.79%
jan 1, 1969
22.771
-0.942
-3.97%
jan 1, 1970
23.991
+1.219
5.35%
jan 1, 1971
25.306
+1.315
5.48%
jan 1, 1972
23.512
-1.793
-7.09%
jan 1, 1973
24.251
+0.739
3.14%
jan 1, 1974
22.797
-1.454
-6.0%
jan 1, 1975
22.874
+0.077
0.34%
jan 1, 1976
29.286
+6.413
28.03%
jan 1, 1977
33.983
+4.697
16.04%
jan 1, 1978
33.231
-0.752
-2.21%
jan 1, 1979
30.693
-2.538
-7.64%
jan 1, 1980
26.038
-4.655
-15.17%
jan 1, 1981
23.836
-2.202
-8.46%
jan 1, 1982
22.24
-1.596
-6.7%
jan 1, 1983
24.324
+2.084
9.37%
jan 1, 1984
24.203
-0.121
-0.5%
jan 1, 1985
22.798
-1.406
-5.81%
jan 1, 1986
23.052
+0.254
1.12%
jan 1, 1987
19.3
-3.752
-16.28%
jan 1, 1988
19.852
+0.553
2.86%
jan 1, 1989
21.96
+2.107
10.62%
jan 1, 1990
21.994
+0.034
0.15%
jan 1, 1991
19.725
-2.269
-10.31%
jan 1, 1992
16.234
-3.491
-17.7%
jan 1, 1993
15.168
-1.066
-6.57%
jan 1, 1994
16.652
+1.484
9.79%
jan 1, 1995
16.865
+0.213
1.28%
jan 1, 1996
17.527
+0.663
3.93%
jan 1, 1997
17.433
-0.094
-0.54%
jan 1, 1998
17.156
-0.277
-1.59%
jan 1, 1999
17.416
+0.26
1.52%
jan 1, 2000
16.286
-1.13
-6.49%
jan 1, 2001
15.543
-0.743
-4.56%
jan 1, 2002
15.485
-0.058
-0.37%
jan 1, 2003
26.973
+11.488
74.19%
jan 1, 2004
26.355
-0.618
-2.29%
jan 1, 2005
24.554
-1.801
-6.83%
jan 1, 2006
24.765
+0.211
0.86%
jan 1, 2007
24.861
+0.096
0.39%
jan 1, 2008
25.041
+0.18
0.72%
jan 1, 2009
24.246
-0.795
-3.18%
jan 1, 2010
21.196
-3.05
-12.58%
jan 1, 2011
21.216
+0.02
0.1%
jan 1, 2012
20.975
-0.241
-1.14%
jan 1, 2013
19.653
-1.323
-6.31%
jan 1, 2014
18.109
-1.544
-7.86%
jan 1, 2015
18.958
+0.849
4.69%
jan 1, 2016
16.038
-2.92
-15.4%
Ranking of countries by current statistics by years


Comments: