29
/
en
AIzaSyAYiBZKx7MnpbEhh9jyipgxe19OcubqV5w
April 1, 2024
256385
Sweden
SWE
true
2
1
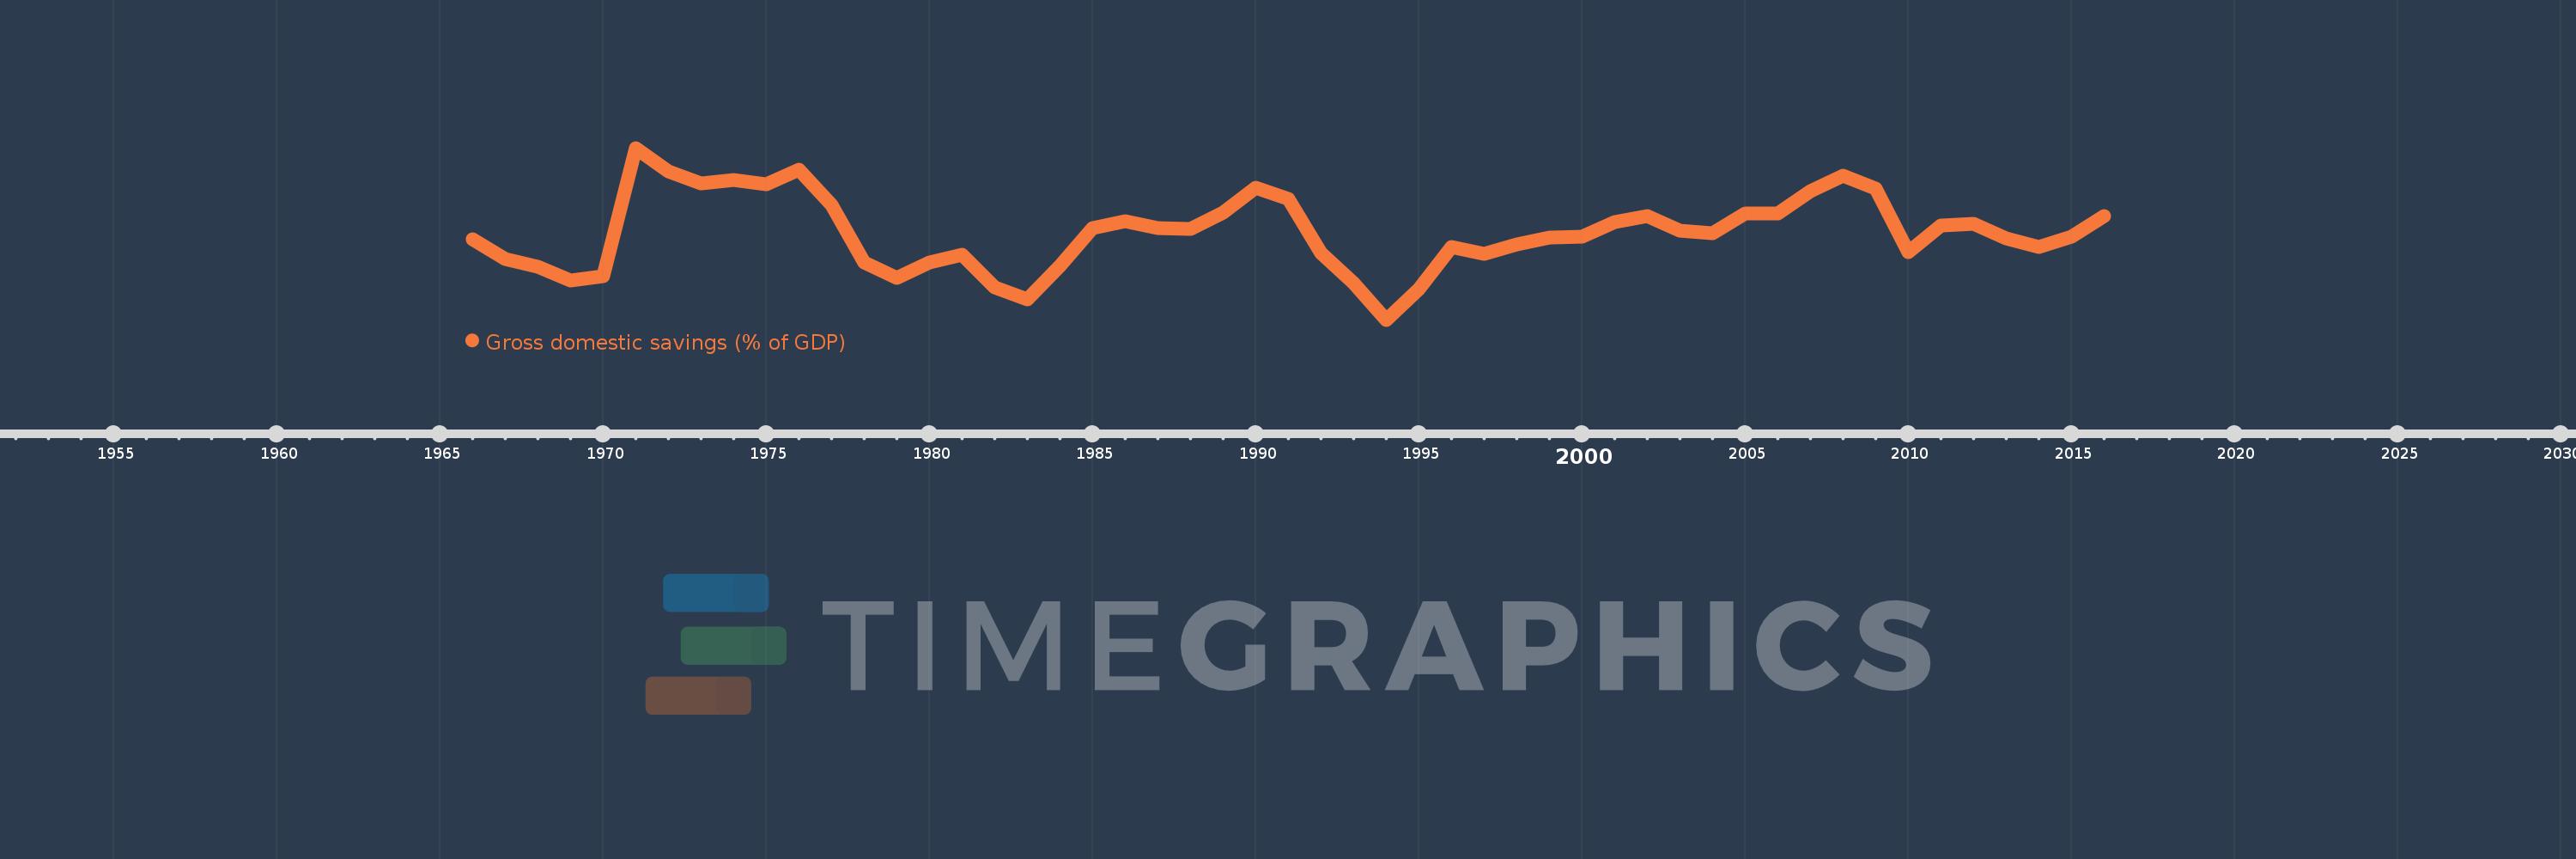
Gross domestic savings (% of GDP)
2016,2015,2014,2013,2012,2011,2010,2009,2008,2007,2006,2005,2004,2003,2002,2001,2000,1999,1998,1997,1996,1995,1994,1993,1992,1991,1990,1989,1988,1987,1986,1985,1984,1983,1982,1981,1980,1979,1978,1977,1976,1975,1974,1973,1972,1971,1970,1969,1968,1967,1966
This statistics in other country:
AfghanistanAlbaniaAlgeriaAngolaAntigua and BarbudaArab WorldArgentinaArmeniaArubaAustraliaAustriaAzerbaijanBahamas, TheBahrainBangladeshBarbadosBelarusBelgiumBelizeBeninBermudaBhutanBoliviaBosnia and HerzegovinaBotswanaBrazilBrunei DarussalamBulgariaBurkina FasoBurundiCabo VerdeCambodiaCameroonCanadaCaribbean small statesCentral African RepublicCentral Europe and the BalticsChadChileChinaColombiaComorosCongo, Dem. Rep.Congo, Rep.Costa RicaCote d'IvoireCroatiaCubaCyprusCzech RepublicDenmarkDjiboutiDominicaDominican RepublicEarly-demographic dividendEast Asia & PacificEast Asia & Pacific (excluding high income)East Asia & Pacific (IDA & IBRD countries)EcuadorEgypt, Arab Rep.El SalvadorEquatorial GuineaEritreaEstoniaEthiopiaEuro areaEurope & Central AsiaEurope & Central Asia (excluding high income)Europe & Central Asia (IDA & IBRD countries)European UnionFaroe IslandsFijiFinlandFragile and conflict affected situationsFranceGabonGambia, TheGeorgiaGermanyGhanaGreeceGrenadaGuatemalaGuineaGuinea-BissauGuyanaHaitiHeavily indebted poor countries (HIPC)High incomeHondurasHong Kong SAR, ChinaHungaryIBRD onlyIcelandIDA & IBRD totalIDA blendIDA onlyIDA totalIndiaIndonesiaIran, Islamic Rep.IraqIrelandIsraelItalyJamaicaJapanJordanKazakhstanKenyaKiribatiKorea, Rep.KosovoKuwaitKyrgyz RepublicLao PDRLate-demographic dividendLatin America & Caribbean Latin America & Caribbean (excluding high income)Latin America & the Caribbean (IDA & IBRD countries)LatviaLeast developed countries: UN classificationLebanonLesothoLiberiaLibyaLithuaniaLow & middle incomeLow incomeLower middle incomeLuxembourgMacao SAR, ChinaMacedonia, FYRMadagascarMalawiMalaysiaMaldivesMaliMaltaMauritaniaMauritiusMexicoMicronesia, Fed. Sts.Middle East & North AfricaMiddle East & North Africa (excluding high income)Middle East & North Africa (IDA & IBRD countries)Middle incomeMoldovaMongoliaMontenegroMoroccoMozambiqueNamibiaNepalNetherlandsNew CaledoniaNew ZealandNicaraguaNigerNigeriaNorth AmericaNorwayOECD membersOmanOther small statesPacific island small statesPakistanPanamaPapua New GuineaParaguayPeruPhilippinesPolandPortugalPost-demographic dividendPre-demographic dividendPuerto RicoQatarRomaniaRussian FederationRwandaSaudi ArabiaSenegalSerbiaSeychellesSierra LeoneSingaporeSlovak RepublicSloveniaSmall statesSolomon IslandsSomaliaSouth AfricaSouth AsiaSouth Asia (IDA & IBRD)South SudanSpainSri LankaSt. Kitts and NevisSt. LuciaSt. Vincent and the GrenadinesSub-Saharan Africa Sub-Saharan Africa (excluding high income)Sub-Saharan Africa (IDA & IBRD countries)SudanSurinameSwazilandSwedenSwitzerlandSyrian Arab RepublicTajikistanTanzaniaThailandTimor-LesteTogoTongaTrinidad and TobagoTunisiaTurkeyTurkmenistanUgandaUkraineUnited Arab EmiratesUnited KingdomUnited StatesUpper middle incomeUruguayUzbekistanVanuatuVenezuela, RBVietnamWest Bank and GazaWorldYemen, Rep.ZambiaZimbabwe Timeline:
This timeline shows a graph from 1966 to 2016 of Sweden. No data until 1965. Number of actual observations by date: 51.
Source name:
World Development Indicators
Source organization:
World Bank national accounts data, and OECD National Accounts data files.
Categories, topics:
Economy & Growth
Last updated:
apr 23, 2017
Indicators value changes by year
Minimum:
22.323
jan 1, 1994
Maximum:
33.394
jan 1, 1971
At the date of observation
Value
Absolute change
Change from previous value
jan 1, 1966
27.532
+27.532
0.0%
jan 1, 1967
26.213
-1.318
-4.79%
jan 1, 1968
25.765
-0.448
-1.71%
jan 1, 1969
24.834
-0.931
-3.61%
jan 1, 1970
25.14
+0.306
1.23%
jan 1, 1971
33.394
+8.254
32.83%
jan 1, 1972
31.872
-1.522
-4.56%
jan 1, 1973
31.128
-0.745
-2.34%
jan 1, 1974
31.35
+0.222
0.71%
jan 1, 1975
31.033
-0.316
-1.01%
jan 1, 1976
31.968
+0.934
3.01%
jan 1, 1977
29.699
-2.269
-7.1%
jan 1, 1978
25.995
-3.704
-12.47%
jan 1, 1979
25.041
-0.954
-3.67%
jan 1, 1980
25.994
+0.953
3.81%
jan 1, 1981
26.514
+0.52
2.0%
jan 1, 1982
24.396
-2.118
-7.99%
jan 1, 1983
23.646
-0.75
-3.08%
jan 1, 1984
25.812
+2.166
9.16%
jan 1, 1985
28.206
+2.394
9.28%
jan 1, 1986
28.65
+0.444
1.57%
jan 1, 1987
28.217
-0.433
-1.51%
jan 1, 1988
28.183
-0.034
-0.12%
jan 1, 1989
29.201
+1.018
3.61%
jan 1, 1990
30.815
+1.614
5.53%
jan 1, 1991
30.096
-0.719
-2.33%
jan 1, 1992
26.634
-3.462
-11.5%
jan 1, 1993
24.666
-1.968
-7.39%
jan 1, 1994
22.323
-2.343
-9.5%
jan 1, 1995
24.31
+1.987
8.9%
jan 1, 1996
27.032
+2.722
11.2%
jan 1, 1997
26.583
-0.449
-1.66%
jan 1, 1998
27.166
+0.583
2.19%
jan 1, 1999
27.647
+0.481
1.77%
jan 1, 2000
27.694
+0.047
0.17%
jan 1, 2001
28.623
+0.929
3.35%
jan 1, 2002
28.982
+0.359
1.25%
jan 1, 2003
28.058
-0.924
-3.19%
jan 1, 2004
27.915
-0.143
-0.51%
jan 1, 2005
29.158
+1.243
4.45%
jan 1, 2006
29.176
+0.019
0.06%
jan 1, 2007
30.617
+1.441
4.94%
jan 1, 2008
31.585
+0.968
3.16%
jan 1, 2009
30.787
-0.798
-2.53%
jan 1, 2010
26.685
-4.101
-13.32%
jan 1, 2011
28.38
+1.695
6.35%
jan 1, 2012
28.52
+0.14
0.49%
jan 1, 2013
27.542
-0.978
-3.43%
jan 1, 2014
27.003
-0.539
-1.96%
jan 1, 2015
27.666
+0.663
2.46%
jan 1, 2016
28.988
+1.322
4.78%
Ranking of countries by current statistics by years


Comments: