29
/
en
AIzaSyAYiBZKx7MnpbEhh9jyipgxe19OcubqV5w
April 1, 2024
210418
Nicaragua
NIC
true
2
1
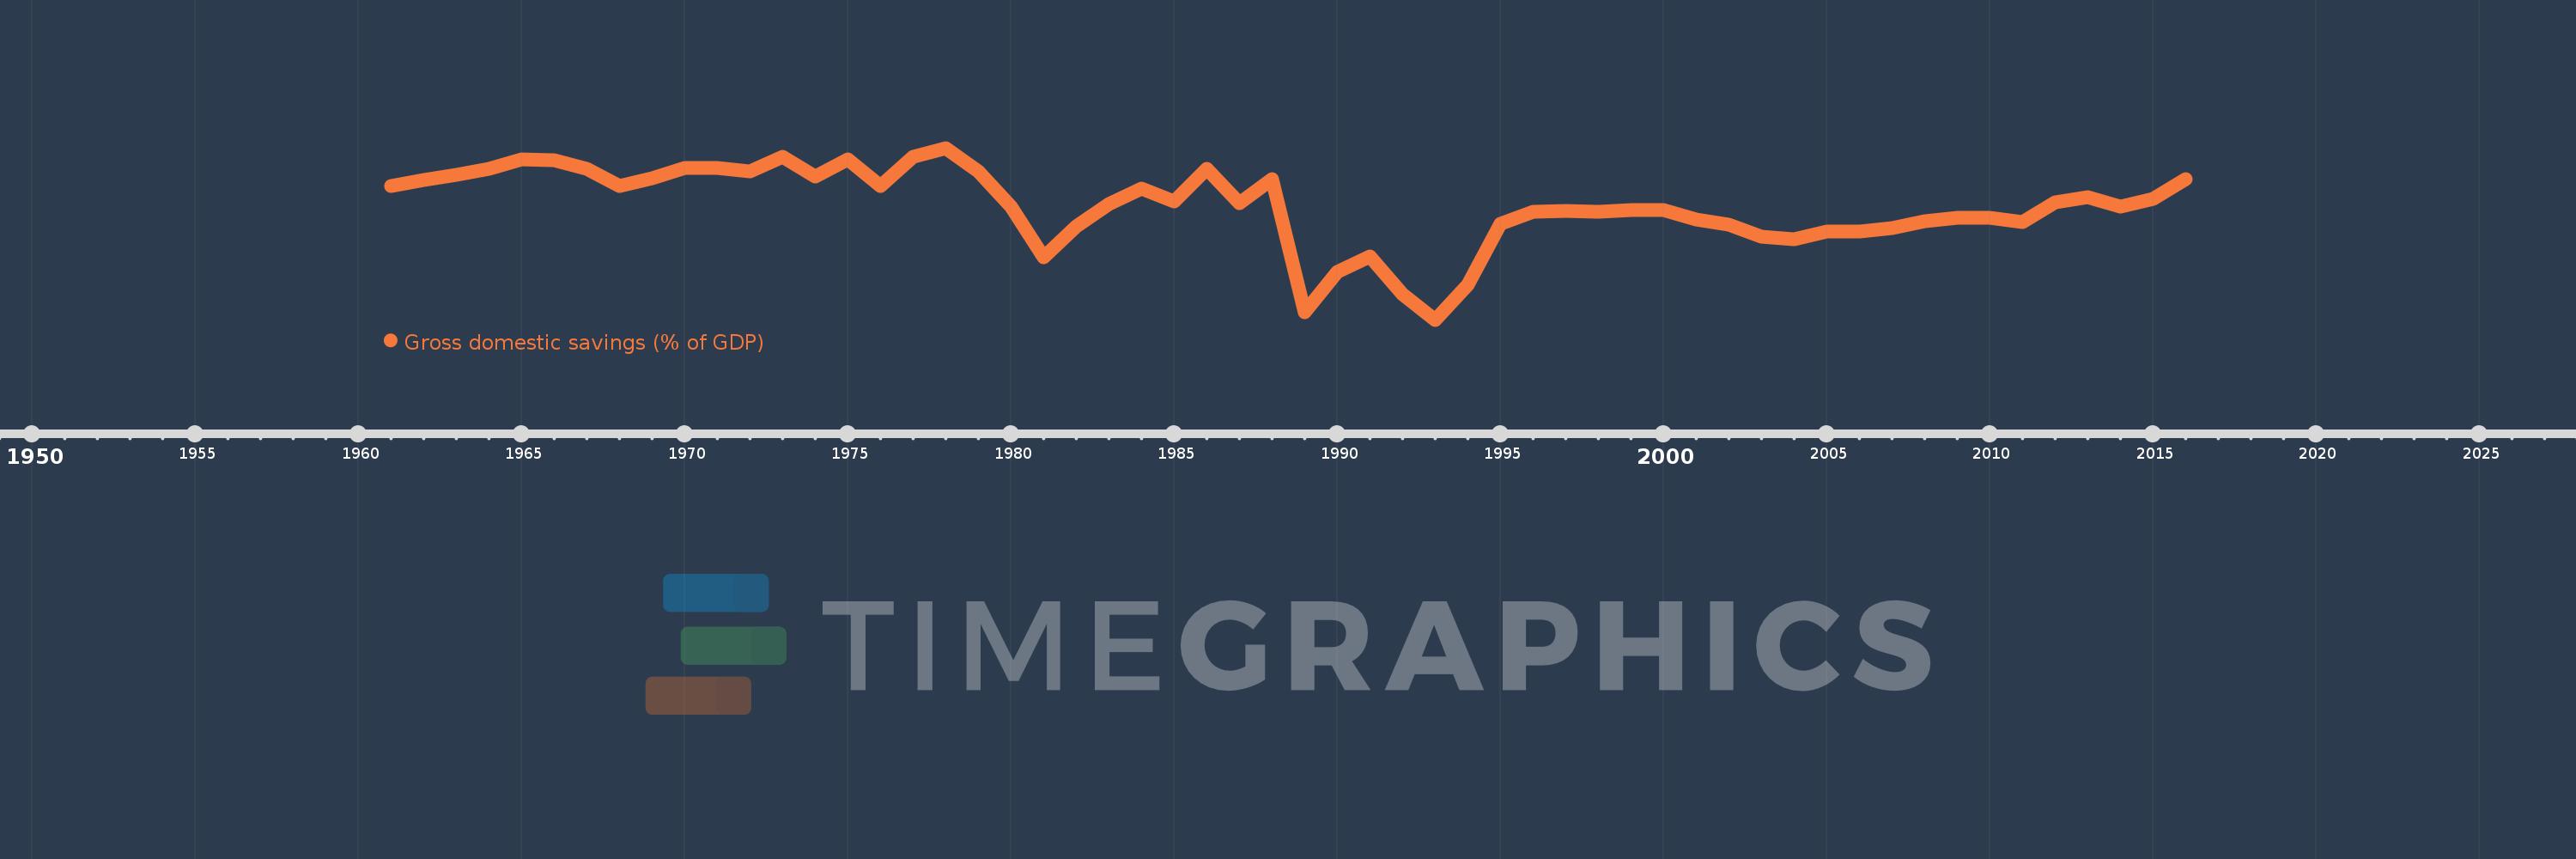
Gross domestic savings (% of GDP)
2016,2015,2014,2013,2012,2011,2010,2009,2008,2007,2006,2005,2004,2003,2002,2001,2000,1999,1998,1997,1996,1995,1994,1993,1992,1991,1990,1989,1988,1987,1986,1985,1984,1983,1982,1981,1980,1979,1978,1977,1976,1975,1974,1973,1972,1971,1970,1969,1968,1967,1966,1965,1964,1963,1962,1961
This statistics in other country:
AfghanistanAlbaniaAlgeriaAngolaAntigua and BarbudaArab WorldArgentinaArmeniaArubaAustraliaAustriaAzerbaijanBahamas, TheBahrainBangladeshBarbadosBelarusBelgiumBelizeBeninBermudaBhutanBoliviaBosnia and HerzegovinaBotswanaBrazilBrunei DarussalamBulgariaBurkina FasoBurundiCabo VerdeCambodiaCameroonCanadaCaribbean small statesCentral African RepublicCentral Europe and the BalticsChadChileChinaColombiaComorosCongo, Dem. Rep.Congo, Rep.Costa RicaCote d'IvoireCroatiaCubaCyprusCzech RepublicDenmarkDjiboutiDominicaDominican RepublicEarly-demographic dividendEast Asia & PacificEast Asia & Pacific (excluding high income)East Asia & Pacific (IDA & IBRD countries)EcuadorEgypt, Arab Rep.El SalvadorEquatorial GuineaEritreaEstoniaEthiopiaEuro areaEurope & Central AsiaEurope & Central Asia (excluding high income)Europe & Central Asia (IDA & IBRD countries)European UnionFaroe IslandsFijiFinlandFragile and conflict affected situationsFranceGabonGambia, TheGeorgiaGermanyGhanaGreeceGrenadaGuatemalaGuineaGuinea-BissauGuyanaHaitiHeavily indebted poor countries (HIPC)High incomeHondurasHong Kong SAR, ChinaHungaryIBRD onlyIcelandIDA & IBRD totalIDA blendIDA onlyIDA totalIndiaIndonesiaIran, Islamic Rep.IraqIrelandIsraelItalyJamaicaJapanJordanKazakhstanKenyaKiribatiKorea, Rep.KosovoKuwaitKyrgyz RepublicLao PDRLate-demographic dividendLatin America & Caribbean Latin America & Caribbean (excluding high income)Latin America & the Caribbean (IDA & IBRD countries)LatviaLeast developed countries: UN classificationLebanonLesothoLiberiaLibyaLithuaniaLow & middle incomeLow incomeLower middle incomeLuxembourgMacao SAR, ChinaMacedonia, FYRMadagascarMalawiMalaysiaMaldivesMaliMaltaMauritaniaMauritiusMexicoMicronesia, Fed. Sts.Middle East & North AfricaMiddle East & North Africa (excluding high income)Middle East & North Africa (IDA & IBRD countries)Middle incomeMoldovaMongoliaMontenegroMoroccoMozambiqueNamibiaNepalNetherlandsNew CaledoniaNew ZealandNicaraguaNigerNigeriaNorth AmericaNorwayOECD membersOmanOther small statesPacific island small statesPakistanPanamaPapua New GuineaParaguayPeruPhilippinesPolandPortugalPost-demographic dividendPre-demographic dividendPuerto RicoQatarRomaniaRussian FederationRwandaSaudi ArabiaSenegalSerbiaSeychellesSierra LeoneSingaporeSlovak RepublicSloveniaSmall statesSolomon IslandsSomaliaSouth AfricaSouth AsiaSouth Asia (IDA & IBRD)South SudanSpainSri LankaSt. Kitts and NevisSt. LuciaSt. Vincent and the GrenadinesSub-Saharan Africa Sub-Saharan Africa (excluding high income)Sub-Saharan Africa (IDA & IBRD countries)SudanSurinameSwazilandSwedenSwitzerlandSyrian Arab RepublicTajikistanTanzaniaThailandTimor-LesteTogoTongaTrinidad and TobagoTunisiaTurkeyTurkmenistanUgandaUkraineUnited Arab EmiratesUnited KingdomUnited StatesUpper middle incomeUruguayUzbekistanVanuatuVenezuela, RBVietnamWest Bank and GazaWorldYemen, Rep.ZambiaZimbabwe Timeline:
This timeline shows a graph from 1961 to 2016 of Nicaragua. No data until 1960. Number of actual observations by date: 56.
Source name:
World Development Indicators
Source organization:
World Bank national accounts data, and OECD National Accounts data files.
Categories, topics:
Economy & Growth
Last updated:
apr 23, 2017
Indicators value changes by year
Minimum:
-15.09
jan 1, 1993
At the date of observation
Value
Absolute change
Change from previous value
jan 1, 1961
12.367
+12.367
0.0%
jan 1, 1962
13.69
+1.323
10.69%
jan 1, 1963
14.751
+1.062
7.75%
jan 1, 1964
15.968
+1.217
8.25%
jan 1, 1965
17.998
+2.03
12.71%
jan 1, 1966
17.812
-0.186
-1.03%
jan 1, 1967
15.984
-1.828
-10.26%
jan 1, 1968
12.41
-3.574
-22.36%
jan 1, 1969
14.029
+1.619
13.04%
jan 1, 1970
16.175
+2.146
15.3%
jan 1, 1971
16.135
-0.04
-0.25%
jan 1, 1972
15.475
-0.659
-4.09%
jan 1, 1973
18.495
+3.02
19.51%
jan 1, 1974
14.389
-4.106
-22.2%
jan 1, 1975
17.965
+3.576
24.85%
jan 1, 1976
12.522
-5.443
-30.3%
jan 1, 1977
18.474
+5.952
47.53%
jan 1, 1978
20.29
+1.816
9.83%
jan 1, 1979
15.5
-4.79
-23.61%
jan 1, 1980
8.152
-7.347
-47.4%
jan 1, 1981
-2.261
-10.413
-127.73%
jan 1, 1982
4.157
+6.418
-283.89%
jan 1, 1983
8.701
+4.544
109.3%
jan 1, 1984
11.889
+3.188
36.64%
jan 1, 1985
9.221
-2.669
-22.45%
jan 1, 1986
16.079
+6.858
74.37%
jan 1, 1987
8.837
-7.241
-45.04%
jan 1, 1988
13.809
+4.972
56.25%
jan 1, 1989
-13.538
-27.347
-198.04%
jan 1, 1990
-5.193
+8.345
-61.64%
jan 1, 1991
-2.118
+3.075
-59.21%
jan 1, 1992
-9.908
-7.789
367.72%
jan 1, 1993
-15.09
-5.183
52.31%
jan 1, 1994
-7.964
+7.126
-47.22%
jan 1, 1995
4.73
+12.694
-159.39%
jan 1, 1996
7.079
+2.35
49.68%
jan 1, 1997
7.389
+0.309
4.37%
jan 1, 1998
7.119
-0.27
-3.65%
jan 1, 1999
7.48
+0.36
5.06%
jan 1, 2000
7.526
+0.046
0.61%
jan 1, 2001
5.573
-1.953
-25.95%
jan 1, 2002
4.411
-1.162
-20.85%
jan 1, 2003
2.035
-2.375
-53.85%
jan 1, 2004
1.485
-0.55
-27.02%
jan 1, 2005
3.035
+1.55
104.34%
jan 1, 2006
3.004
-0.032
-1.04%
jan 1, 2007
3.783
+0.779
25.95%
jan 1, 2008
5.17
+1.387
36.66%
jan 1, 2009
5.958
+0.788
15.25%
jan 1, 2010
5.833
-0.125
-2.09%
jan 1, 2011
5.099
-0.734
-12.59%
jan 1, 2012
9.06
+3.961
77.68%
jan 1, 2013
10.133
+1.073
11.84%
jan 1, 2014
8.259
-1.874
-18.49%
jan 1, 2015
9.805
+1.546
18.72%
jan 1, 2016
13.919
+4.114
41.96%
Ranking of countries by current statistics by years


Comments: