29
/
en
AIzaSyAYiBZKx7MnpbEhh9jyipgxe19OcubqV5w
April 1, 2024
55557
Pre-demographic dividend
PRE
false
2
1
Gross domestic savings (% of GDP)
2016,2015,2014,2013,2012,2011,2010,2009,2008,2007,2006,2005,2004,2003,2002,2001,2000,1999,1998,1997,1996,1995,1994,1993,1992,1991,1990,1989,1988,1987,1986
This statistics in other country:
AfghanistanAlbaniaAlgeriaAngolaAntigua and BarbudaArab WorldArgentinaArmeniaArubaAustraliaAustriaAzerbaijanBahamas, TheBahrainBangladeshBarbadosBelarusBelgiumBelizeBeninBermudaBhutanBoliviaBosnia and HerzegovinaBotswanaBrazilBrunei DarussalamBulgariaBurkina FasoBurundiCabo VerdeCambodiaCameroonCanadaCaribbean small statesCentral African RepublicCentral Europe and the BalticsChadChileChinaColombiaComorosCongo, Dem. Rep.Congo, Rep.Costa RicaCote d'IvoireCroatiaCubaCyprusCzech RepublicDenmarkDjiboutiDominicaDominican RepublicEarly-demographic dividendEast Asia & PacificEast Asia & Pacific (excluding high income)East Asia & Pacific (IDA & IBRD countries)EcuadorEgypt, Arab Rep.El SalvadorEquatorial GuineaEritreaEstoniaEthiopiaEuro areaEurope & Central AsiaEurope & Central Asia (excluding high income)Europe & Central Asia (IDA & IBRD countries)European UnionFaroe IslandsFijiFinlandFragile and conflict affected situationsFranceGabonGambia, TheGeorgiaGermanyGhanaGreeceGrenadaGuatemalaGuineaGuinea-BissauGuyanaHaitiHeavily indebted poor countries (HIPC)High incomeHondurasHong Kong SAR, ChinaHungaryIBRD onlyIcelandIDA & IBRD totalIDA blendIDA onlyIDA totalIndiaIndonesiaIran, Islamic Rep.IraqIrelandIsraelItalyJamaicaJapanJordanKazakhstanKenyaKiribatiKorea, Rep.KosovoKuwaitKyrgyz RepublicLao PDRLate-demographic dividendLatin America & Caribbean Latin America & Caribbean (excluding high income)Latin America & the Caribbean (IDA & IBRD countries)LatviaLeast developed countries: UN classificationLebanonLesothoLiberiaLibyaLithuaniaLow & middle incomeLow incomeLower middle incomeLuxembourgMacao SAR, ChinaMacedonia, FYRMadagascarMalawiMalaysiaMaldivesMaliMaltaMauritaniaMauritiusMexicoMicronesia, Fed. Sts.Middle East & North AfricaMiddle East & North Africa (excluding high income)Middle East & North Africa (IDA & IBRD countries)Middle incomeMoldovaMongoliaMontenegroMoroccoMozambiqueNamibiaNepalNetherlandsNew CaledoniaNew ZealandNicaraguaNigerNigeriaNorth AmericaNorwayOECD membersOmanOther small statesPacific island small statesPakistanPanamaPapua New GuineaParaguayPeruPhilippinesPolandPortugalPost-demographic dividendPre-demographic dividendPuerto RicoQatarRomaniaRussian FederationRwandaSaudi ArabiaSenegalSerbiaSeychellesSierra LeoneSingaporeSlovak RepublicSloveniaSmall statesSolomon IslandsSomaliaSouth AfricaSouth AsiaSouth Asia (IDA & IBRD)South SudanSpainSri LankaSt. Kitts and NevisSt. LuciaSt. Vincent and the GrenadinesSub-Saharan Africa Sub-Saharan Africa (excluding high income)Sub-Saharan Africa (IDA & IBRD countries)SudanSurinameSwazilandSwedenSwitzerlandSyrian Arab RepublicTajikistanTanzaniaThailandTimor-LesteTogoTongaTrinidad and TobagoTunisiaTurkeyTurkmenistanUgandaUkraineUnited Arab EmiratesUnited KingdomUnited StatesUpper middle incomeUruguayUzbekistanVanuatuVenezuela, RBVietnamWest Bank and GazaWorldYemen, Rep.ZambiaZimbabwe Timeline:
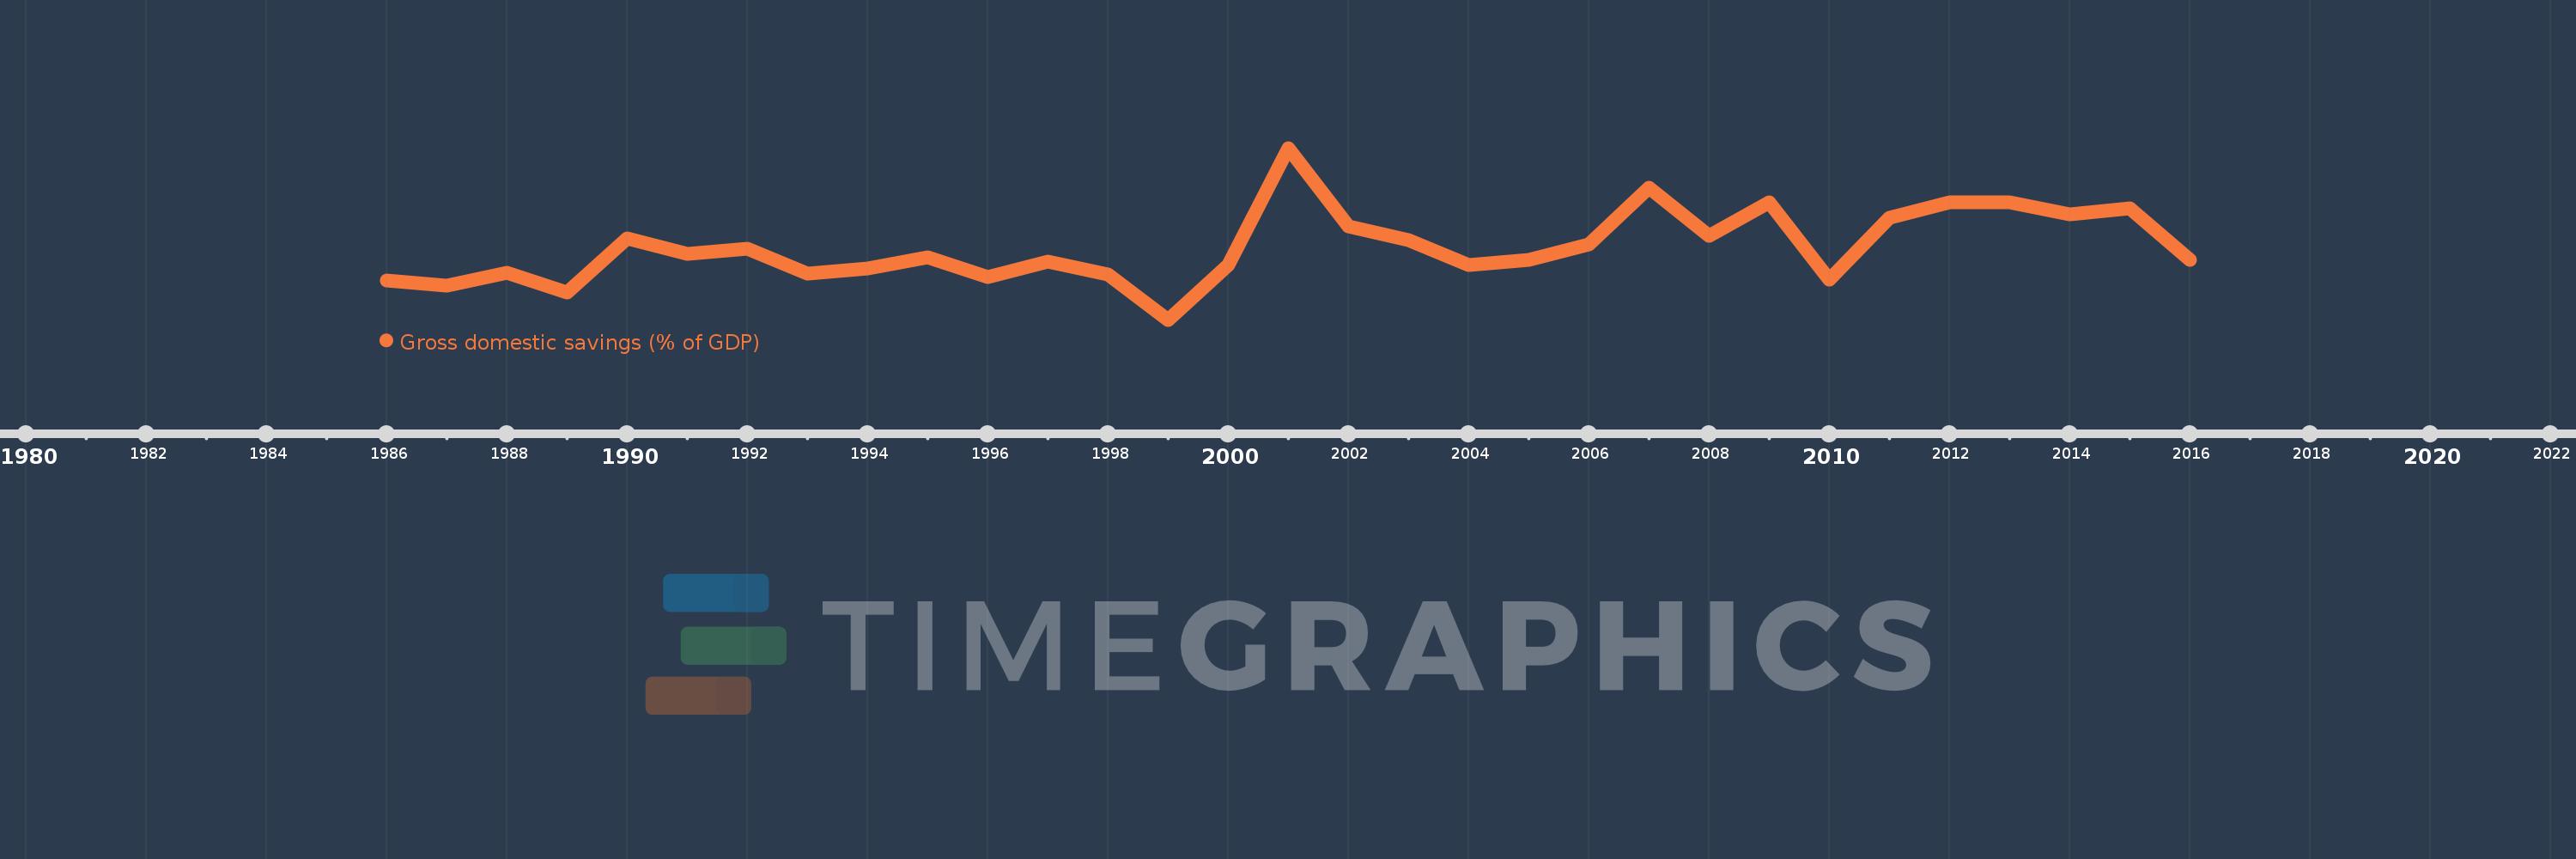
This timeline shows a graph from 1986 to 2016 of Pre-demographic dividend. No data until 1985. Number of actual observations by date: 31.
Source name:
World Development Indicators
Source organization:
World Bank national accounts data, and OECD National Accounts data files.
Categories, topics:
Economy & Growth
Last updated:
apr 23, 2017
Indicators value changes by year
Maximum:
30.862
jan 1, 2001
At the date of observation
Value
Absolute change
Change from previous value
jan 1, 1986
12.454
+12.454
0.0%
jan 1, 1987
11.778
-0.676
-5.43%
jan 1, 1988
13.564
+1.786
15.16%
jan 1, 1989
10.849
-2.714
-20.01%
jan 1, 1990
18.379
+7.53
69.41%
jan 1, 1991
16.175
-2.204
-11.99%
jan 1, 1992
16.945
+0.77
4.76%
jan 1, 1993
13.403
-3.542
-20.9%
jan 1, 1994
14.166
+0.762
5.69%
jan 1, 1995
15.726
+1.56
11.01%
jan 1, 1996
12.953
-2.772
-17.63%
jan 1, 1997
15.07
+2.117
16.34%
jan 1, 1998
13.306
-1.764
-11.71%
jan 1, 1999
7.04
-6.266
-47.09%
jan 1, 2000
14.623
+7.582
107.69%
jan 1, 2001
30.862
+16.239
111.06%
jan 1, 2002
20.034
-10.828
-35.08%
jan 1, 2003
18.075
-1.959
-9.78%
jan 1, 2004
14.634
-3.441
-19.04%
jan 1, 2005
15.296
+0.662
4.52%
jan 1, 2006
17.541
+2.245
14.68%
jan 1, 2007
25.355
+7.814
44.54%
jan 1, 2008
18.673
-6.682
-26.35%
jan 1, 2009
23.363
+4.69
25.12%
jan 1, 2010
12.642
-10.721
-45.89%
jan 1, 2011
21.189
+8.547
67.61%
jan 1, 2012
23.319
+2.131
10.06%
jan 1, 2013
23.3
-0.019
-0.08%
jan 1, 2014
21.699
-1.601
-6.87%
jan 1, 2015
22.541
+0.843
3.88%
jan 1, 2016
15.368
-7.173
-31.82%
Ranking of countries by current statistics by years


Comments: