29
/
en
AIzaSyAYiBZKx7MnpbEhh9jyipgxe19OcubqV5w
April 1, 2024
64761
Albania
ALB
true
2
1
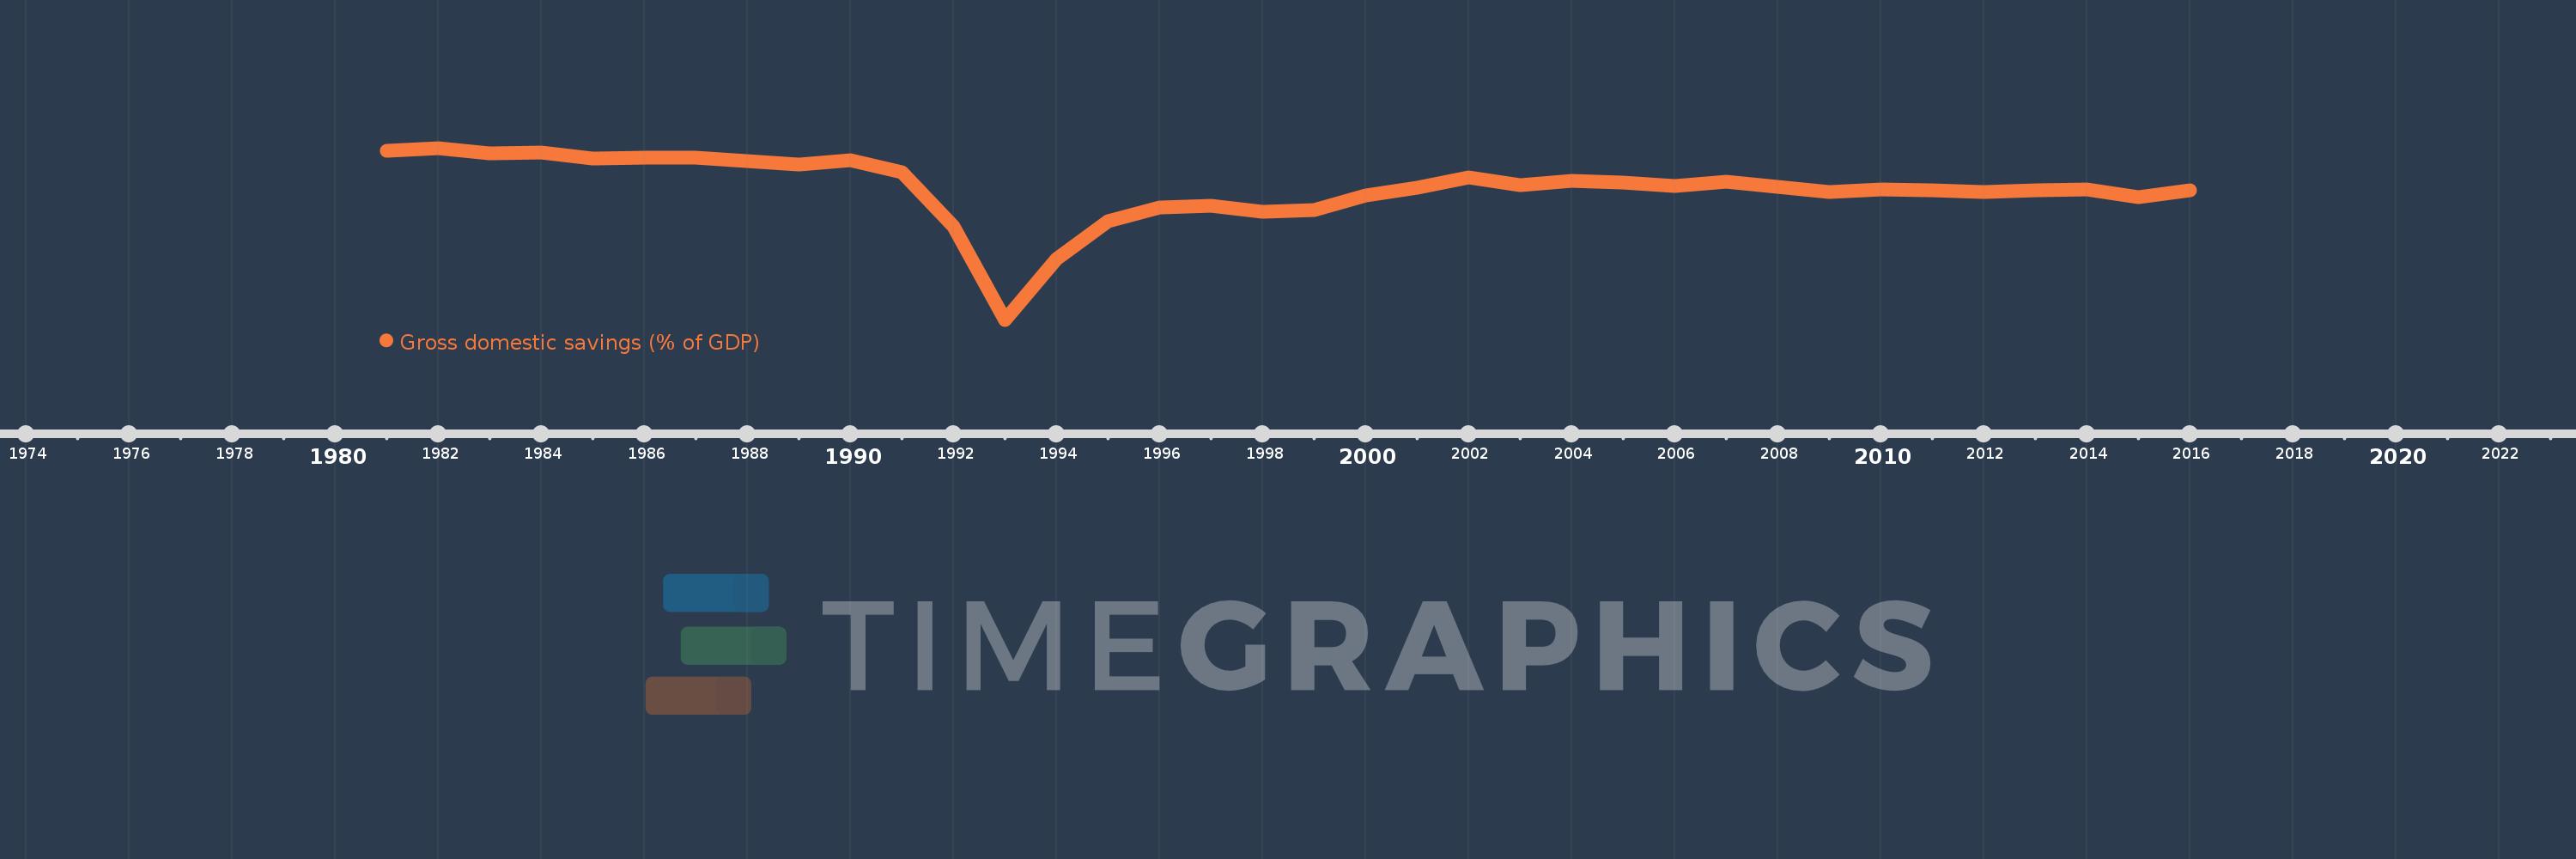
Gross domestic savings (% of GDP)
2016,2015,2014,2013,2012,2011,2010,2009,2008,2007,2006,2005,2004,2003,2002,2001,2000,1999,1998,1997,1996,1995,1994,1993,1992,1991,1990,1989,1988,1987,1986,1985,1984,1983,1982,1981
This statistics in other country:
AfghanistanAlbaniaAlgeriaAngolaAntigua and BarbudaArab WorldArgentinaArmeniaArubaAustraliaAustriaAzerbaijanBahamas, TheBahrainBangladeshBarbadosBelarusBelgiumBelizeBeninBermudaBhutanBoliviaBosnia and HerzegovinaBotswanaBrazilBrunei DarussalamBulgariaBurkina FasoBurundiCabo VerdeCambodiaCameroonCanadaCaribbean small statesCentral African RepublicCentral Europe and the BalticsChadChileChinaColombiaComorosCongo, Dem. Rep.Congo, Rep.Costa RicaCote d'IvoireCroatiaCubaCyprusCzech RepublicDenmarkDjiboutiDominicaDominican RepublicEarly-demographic dividendEast Asia & PacificEast Asia & Pacific (excluding high income)East Asia & Pacific (IDA & IBRD countries)EcuadorEgypt, Arab Rep.El SalvadorEquatorial GuineaEritreaEstoniaEthiopiaEuro areaEurope & Central AsiaEurope & Central Asia (excluding high income)Europe & Central Asia (IDA & IBRD countries)European UnionFaroe IslandsFijiFinlandFragile and conflict affected situationsFranceGabonGambia, TheGeorgiaGermanyGhanaGreeceGrenadaGuatemalaGuineaGuinea-BissauGuyanaHaitiHeavily indebted poor countries (HIPC)High incomeHondurasHong Kong SAR, ChinaHungaryIBRD onlyIcelandIDA & IBRD totalIDA blendIDA onlyIDA totalIndiaIndonesiaIran, Islamic Rep.IraqIrelandIsraelItalyJamaicaJapanJordanKazakhstanKenyaKiribatiKorea, Rep.KosovoKuwaitKyrgyz RepublicLao PDRLate-demographic dividendLatin America & Caribbean Latin America & Caribbean (excluding high income)Latin America & the Caribbean (IDA & IBRD countries)LatviaLeast developed countries: UN classificationLebanonLesothoLiberiaLibyaLithuaniaLow & middle incomeLow incomeLower middle incomeLuxembourgMacao SAR, ChinaMacedonia, FYRMadagascarMalawiMalaysiaMaldivesMaliMaltaMauritaniaMauritiusMexicoMicronesia, Fed. Sts.Middle East & North AfricaMiddle East & North Africa (excluding high income)Middle East & North Africa (IDA & IBRD countries)Middle incomeMoldovaMongoliaMontenegroMoroccoMozambiqueNamibiaNepalNetherlandsNew CaledoniaNew ZealandNicaraguaNigerNigeriaNorth AmericaNorwayOECD membersOmanOther small statesPacific island small statesPakistanPanamaPapua New GuineaParaguayPeruPhilippinesPolandPortugalPost-demographic dividendPre-demographic dividendPuerto RicoQatarRomaniaRussian FederationRwandaSaudi ArabiaSenegalSerbiaSeychellesSierra LeoneSingaporeSlovak RepublicSloveniaSmall statesSolomon IslandsSomaliaSouth AfricaSouth AsiaSouth Asia (IDA & IBRD)South SudanSpainSri LankaSt. Kitts and NevisSt. LuciaSt. Vincent and the GrenadinesSub-Saharan Africa Sub-Saharan Africa (excluding high income)Sub-Saharan Africa (IDA & IBRD countries)SudanSurinameSwazilandSwedenSwitzerlandSyrian Arab RepublicTajikistanTanzaniaThailandTimor-LesteTogoTongaTrinidad and TobagoTunisiaTurkeyTurkmenistanUgandaUkraineUnited Arab EmiratesUnited KingdomUnited StatesUpper middle incomeUruguayUzbekistanVanuatuVenezuela, RBVietnamWest Bank and GazaWorldYemen, Rep.ZambiaZimbabwe Timeline:
This timeline shows a graph from 1981 to 2016 of Albania. No data until 1980. Number of actual observations by date: 36.
Source name:
World Development Indicators
Source organization:
World Bank national accounts data, and OECD National Accounts data files.
Categories, topics:
Economy & Growth
Last updated:
apr 23, 2017
Indicators value changes by year
Minimum:
-71.822
jan 1, 1993
Maximum:
36.589
jan 1, 1982
At the date of observation
Value
Absolute change
Change from previous value
jan 1, 1981
34.954
+34.954
0.0%
jan 1, 1982
36.589
+1.635
4.68%
jan 1, 1983
33.415
-3.174
-8.68%
jan 1, 1984
33.461
+0.047
0.14%
jan 1, 1985
29.816
-3.645
-10.89%
jan 1, 1986
30.538
+0.721
2.42%
jan 1, 1987
30.499
-0.039
-0.13%
jan 1, 1988
28.322
-2.177
-7.14%
jan 1, 1989
26.068
-2.254
-7.96%
jan 1, 1990
28.944
+2.876
11.03%
jan 1, 1991
20.978
-7.965
-27.52%
jan 1, 1992
-13.028
-34.007
-162.1%
jan 1, 1993
-71.822
-58.793
451.27%
jan 1, 1994
-33.67
+38.152
-53.12%
jan 1, 1995
-9.699
+23.971
-71.2%
jan 1, 1996
-1.037
+8.662
-89.31%
jan 1, 1997
0.326
+1.362
-131.41%
jan 1, 1998
-3.953
-4.279
-1.31K%
jan 1, 1999
-2.769
+1.184
-29.95%
jan 1, 2000
6.59
+9.359
-337.98%
jan 1, 2001
11.548
+4.958
75.23%
jan 1, 2002
17.793
+6.245
54.08%
jan 1, 2003
13.166
-4.627
-26.01%
jan 1, 2004
15.744
+2.578
19.58%
jan 1, 2005
14.808
-0.936
-5.95%
jan 1, 2006
12.338
-2.47
-16.68%
jan 1, 2007
15.393
+3.055
24.76%
jan 1, 2008
11.952
-3.441
-22.36%
jan 1, 2009
8.932
-3.02
-25.27%
jan 1, 2010
10.4
+1.468
16.44%
jan 1, 2011
9.724
-0.676
-6.5%
jan 1, 2012
8.678
-1.046
-10.76%
jan 1, 2013
9.693
+1.015
11.7%
jan 1, 2014
10.327
+0.634
6.54%
jan 1, 2015
5.597
-4.73
-45.8%
jan 1, 2016
9.705
+4.108
73.4%
Ranking of countries by current statistics by years


Comments: