29
/
en
AIzaSyAYiBZKx7MnpbEhh9jyipgxe19OcubqV5w
April 1, 2024
112297
Costa Rica
CRI
true
2
1
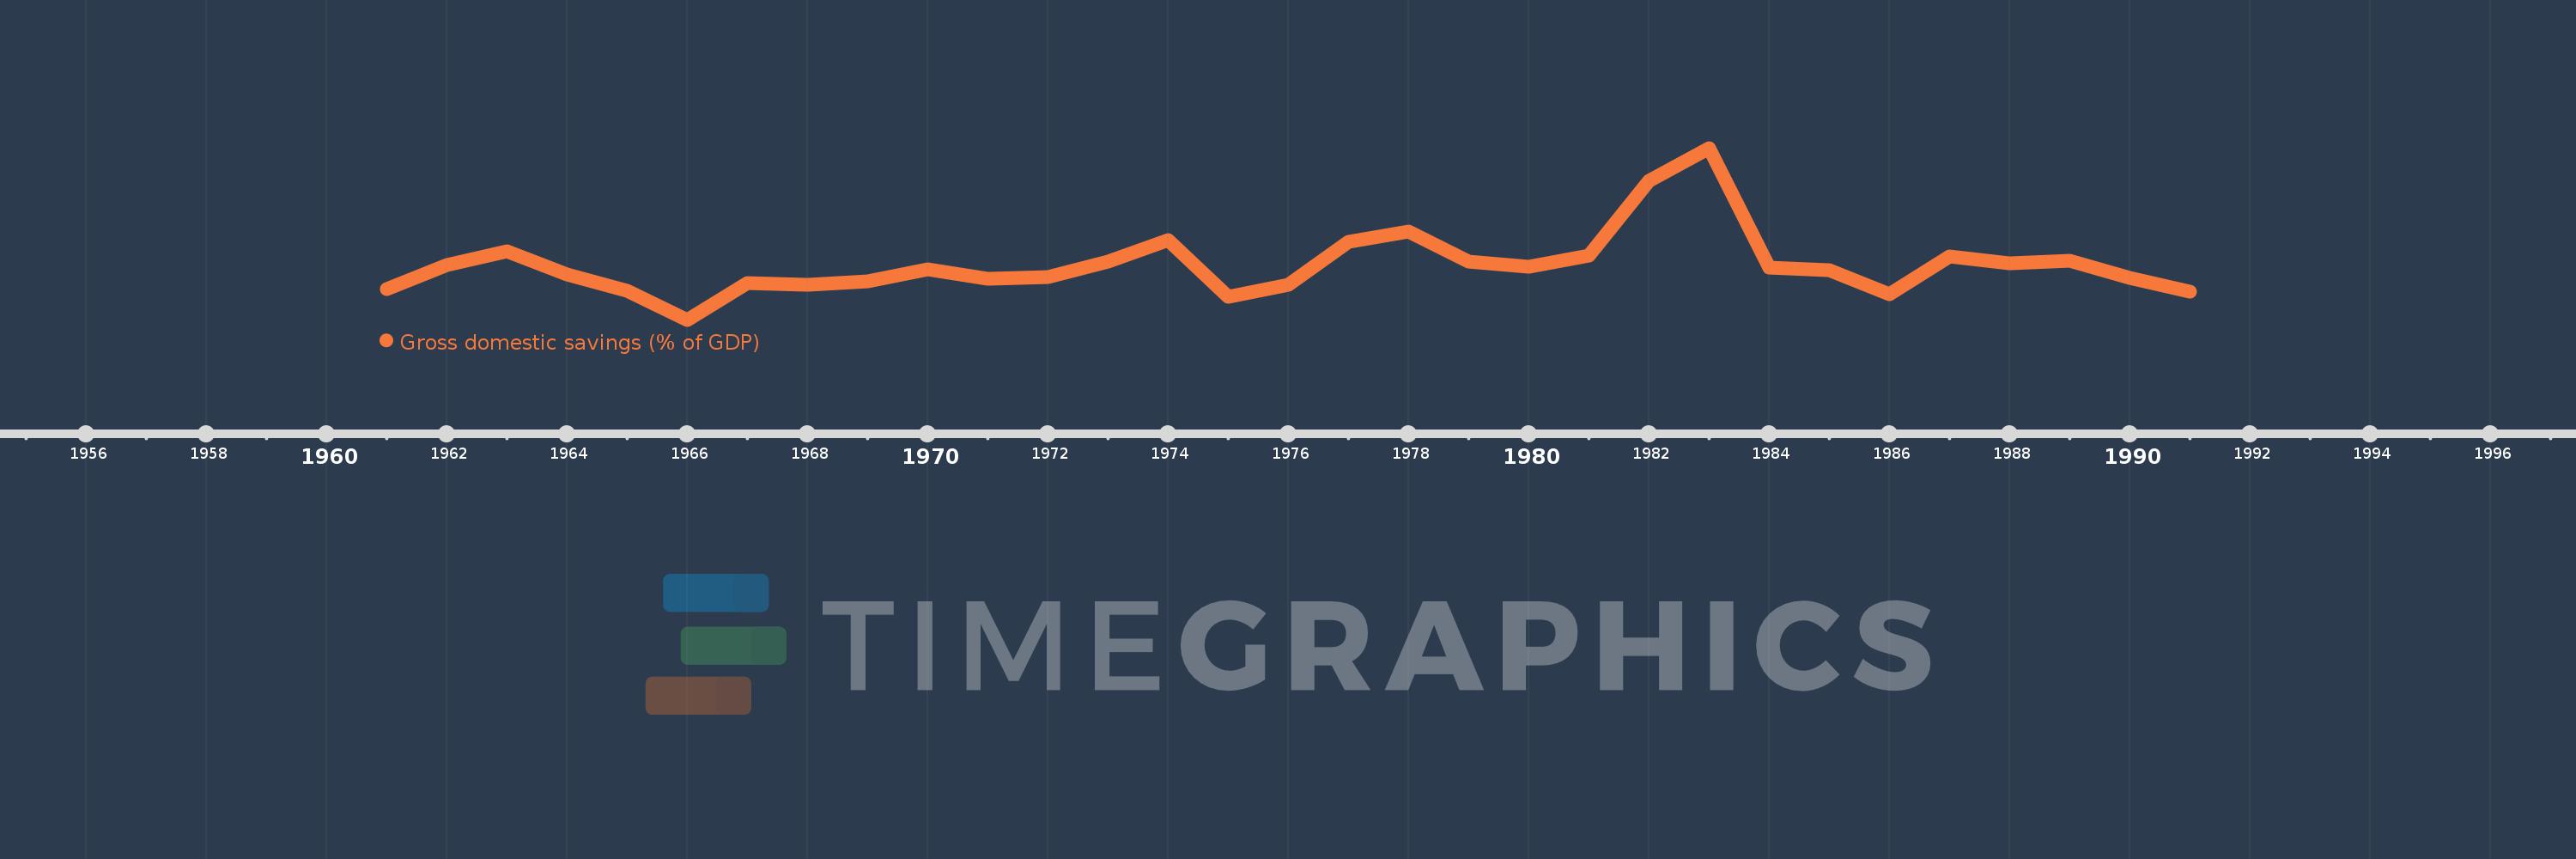
Gross domestic savings (% of GDP)
1991,1990,1989,1988,1987,1986,1985,1984,1983,1982,1981,1980,1979,1978,1977,1976,1975,1974,1973,1972,1971,1970,1969,1968,1967,1966,1965,1964,1963,1962,1961
This statistics in other country:
AfghanistanAlbaniaAlgeriaAngolaAntigua and BarbudaArab WorldArgentinaArmeniaArubaAustraliaAustriaAzerbaijanBahamas, TheBahrainBangladeshBarbadosBelarusBelgiumBelizeBeninBermudaBhutanBoliviaBosnia and HerzegovinaBotswanaBrazilBrunei DarussalamBulgariaBurkina FasoBurundiCabo VerdeCambodiaCameroonCanadaCaribbean small statesCentral African RepublicCentral Europe and the BalticsChadChileChinaColombiaComorosCongo, Dem. Rep.Congo, Rep.Costa RicaCote d'IvoireCroatiaCubaCyprusCzech RepublicDenmarkDjiboutiDominicaDominican RepublicEarly-demographic dividendEast Asia & PacificEast Asia & Pacific (excluding high income)East Asia & Pacific (IDA & IBRD countries)EcuadorEgypt, Arab Rep.El SalvadorEquatorial GuineaEritreaEstoniaEthiopiaEuro areaEurope & Central AsiaEurope & Central Asia (excluding high income)Europe & Central Asia (IDA & IBRD countries)European UnionFaroe IslandsFijiFinlandFragile and conflict affected situationsFranceGabonGambia, TheGeorgiaGermanyGhanaGreeceGrenadaGuatemalaGuineaGuinea-BissauGuyanaHaitiHeavily indebted poor countries (HIPC)High incomeHondurasHong Kong SAR, ChinaHungaryIBRD onlyIcelandIDA & IBRD totalIDA blendIDA onlyIDA totalIndiaIndonesiaIran, Islamic Rep.IraqIrelandIsraelItalyJamaicaJapanJordanKazakhstanKenyaKiribatiKorea, Rep.KosovoKuwaitKyrgyz RepublicLao PDRLate-demographic dividendLatin America & Caribbean Latin America & Caribbean (excluding high income)Latin America & the Caribbean (IDA & IBRD countries)LatviaLeast developed countries: UN classificationLebanonLesothoLiberiaLibyaLithuaniaLow & middle incomeLow incomeLower middle incomeLuxembourgMacao SAR, ChinaMacedonia, FYRMadagascarMalawiMalaysiaMaldivesMaliMaltaMauritaniaMauritiusMexicoMicronesia, Fed. Sts.Middle East & North AfricaMiddle East & North Africa (excluding high income)Middle East & North Africa (IDA & IBRD countries)Middle incomeMoldovaMongoliaMontenegroMoroccoMozambiqueNamibiaNepalNetherlandsNew CaledoniaNew ZealandNicaraguaNigerNigeriaNorth AmericaNorwayOECD membersOmanOther small statesPacific island small statesPakistanPanamaPapua New GuineaParaguayPeruPhilippinesPolandPortugalPost-demographic dividendPre-demographic dividendPuerto RicoQatarRomaniaRussian FederationRwandaSaudi ArabiaSenegalSerbiaSeychellesSierra LeoneSingaporeSlovak RepublicSloveniaSmall statesSolomon IslandsSomaliaSouth AfricaSouth AsiaSouth Asia (IDA & IBRD)South SudanSpainSri LankaSt. Kitts and NevisSt. LuciaSt. Vincent and the GrenadinesSub-Saharan Africa Sub-Saharan Africa (excluding high income)Sub-Saharan Africa (IDA & IBRD countries)SudanSurinameSwazilandSwedenSwitzerlandSyrian Arab RepublicTajikistanTanzaniaThailandTimor-LesteTogoTongaTrinidad and TobagoTunisiaTurkeyTurkmenistanUgandaUkraineUnited Arab EmiratesUnited KingdomUnited StatesUpper middle incomeUruguayUzbekistanVanuatuVenezuela, RBVietnamWest Bank and GazaWorldYemen, Rep.ZambiaZimbabwe Timeline:
This timeline shows a graph from 1961 to 1991 of Costa Rica. No data until 1960. Number of actual observations by date: 31.
Source name:
World Development Indicators
Source organization:
World Bank national accounts data, and OECD National Accounts data files.
Categories, topics:
Economy & Growth
Last updated:
apr 23, 2017
Indicators value changes by year
Maximum:
27.605
jan 1, 1983
At the date of observation
Value
Absolute change
Change from previous value
jan 1, 1961
12.739
+12.739
0.0%
jan 1, 1962
15.26
+2.521
19.79%
jan 1, 1963
16.698
+1.438
9.43%
jan 1, 1964
14.238
-2.46
-14.73%
jan 1, 1965
12.502
-1.736
-12.19%
jan 1, 1966
9.49
-3.012
-24.1%
jan 1, 1967
13.348
+3.858
40.65%
jan 1, 1968
13.175
-0.173
-1.3%
jan 1, 1969
13.516
+0.341
2.59%
jan 1, 1970
14.837
+1.322
9.78%
jan 1, 1971
13.767
-1.071
-7.22%
jan 1, 1972
13.948
+0.182
1.32%
jan 1, 1973
15.591
+1.642
11.77%
jan 1, 1974
17.892
+2.302
14.76%
jan 1, 1975
11.928
-5.964
-33.33%
jan 1, 1976
13.155
+1.227
10.29%
jan 1, 1977
17.66
+4.505
34.25%
jan 1, 1978
18.804
+1.143
6.47%
jan 1, 1979
15.611
-3.193
-16.98%
jan 1, 1980
15.043
-0.568
-3.64%
jan 1, 1981
16.234
+1.19
7.91%
jan 1, 1982
24.119
+7.885
48.57%
jan 1, 1983
27.605
+3.486
14.45%
jan 1, 1984
14.948
-12.657
-45.85%
jan 1, 1985
14.674
-0.274
-1.83%
jan 1, 1986
12.151
-2.523
-17.19%
jan 1, 1987
16.142
+3.991
32.85%
jan 1, 1988
15.481
-0.661
-4.1%
jan 1, 1989
15.697
+0.216
1.4%
jan 1, 1990
13.922
-1.775
-11.31%
jan 1, 1991
12.415
-1.507
-10.82%
Ranking of countries by current statistics by years


Comments: