29
/
en
AIzaSyAYiBZKx7MnpbEhh9jyipgxe19OcubqV5w
April 1, 2024
146885
Guinea-Bissau
GNB
true
2
1
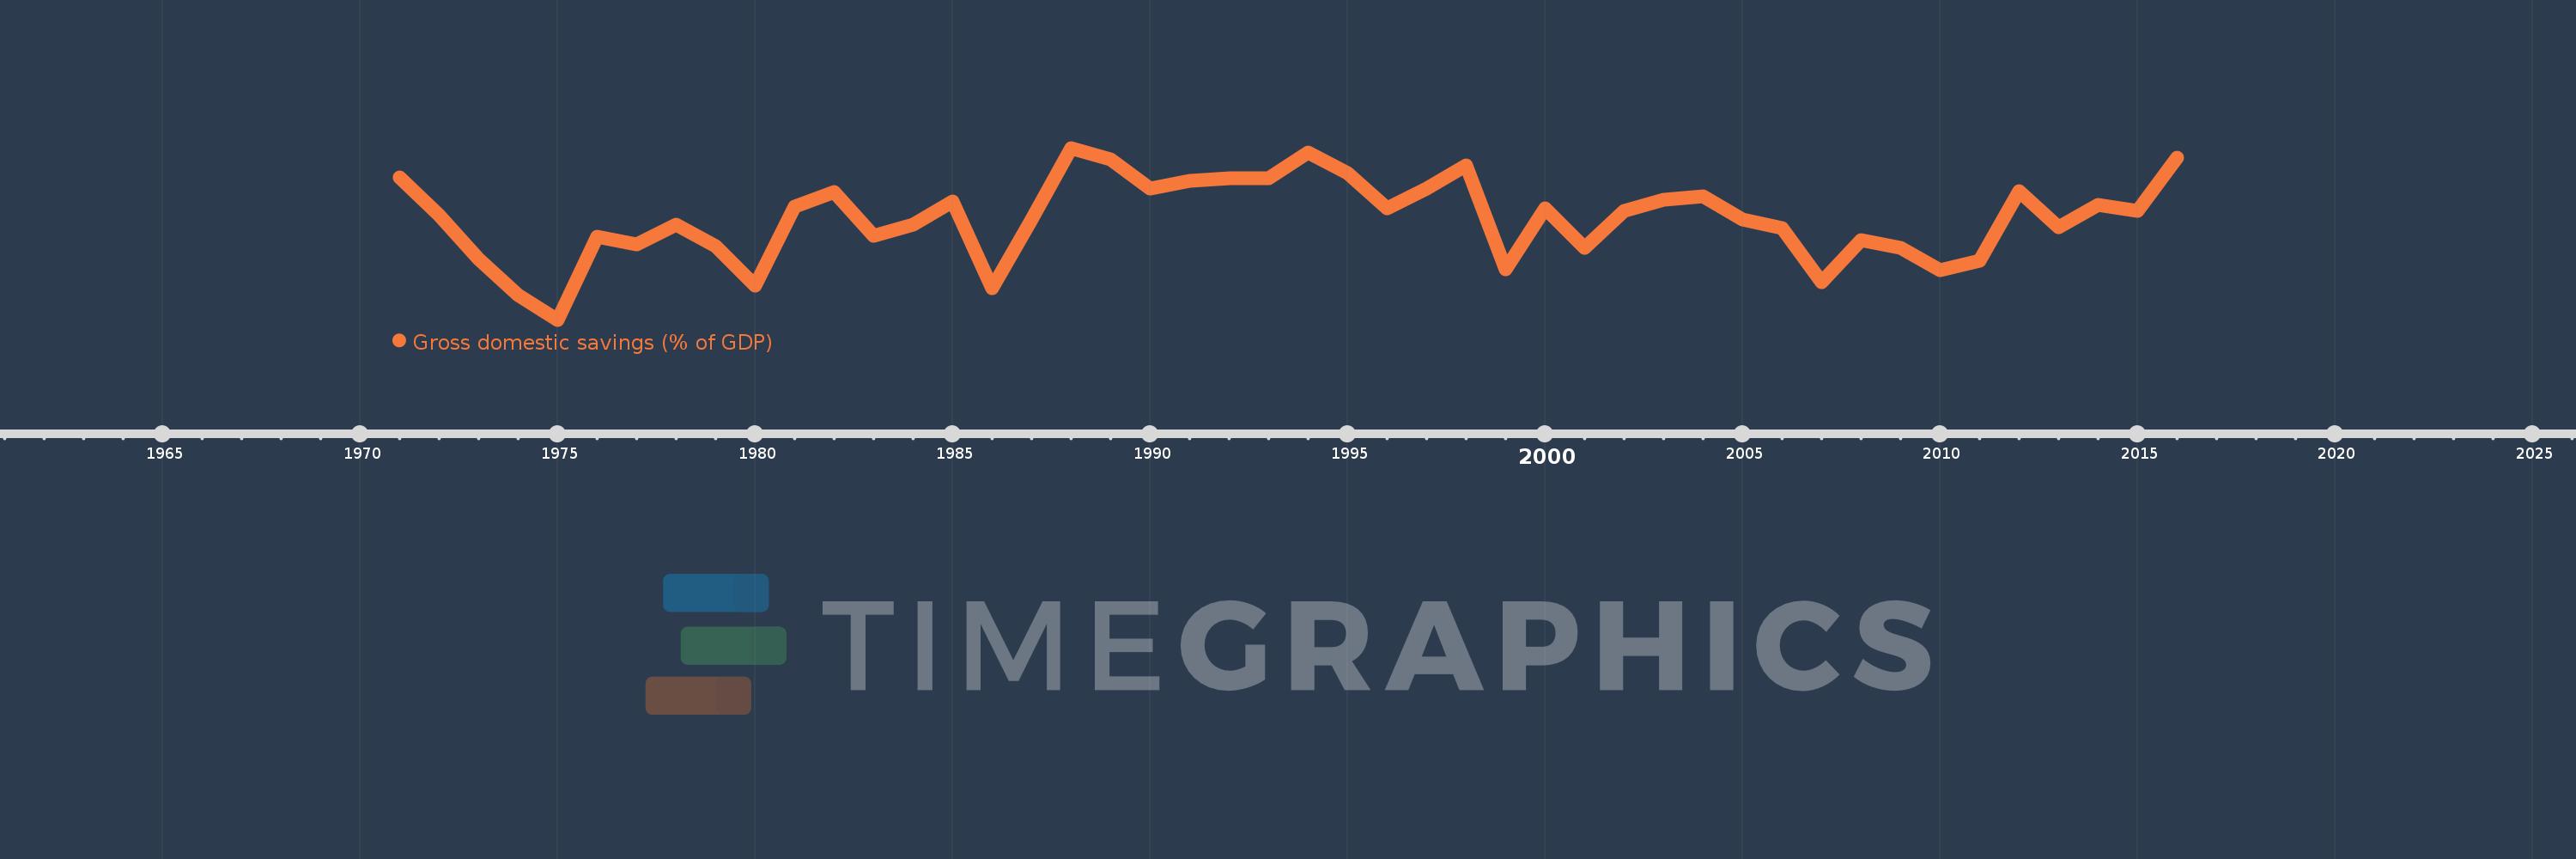
Gross domestic savings (% of GDP)
2016,2015,2014,2013,2012,2011,2010,2009,2008,2007,2006,2005,2004,2003,2002,2001,2000,1999,1998,1997,1996,1995,1994,1993,1992,1991,1990,1989,1988,1987,1986,1985,1984,1983,1982,1981,1980,1979,1978,1977,1976,1975,1974,1973,1972,1971
This statistics in other country:
AfghanistanAlbaniaAlgeriaAngolaAntigua and BarbudaArab WorldArgentinaArmeniaArubaAustraliaAustriaAzerbaijanBahamas, TheBahrainBangladeshBarbadosBelarusBelgiumBelizeBeninBermudaBhutanBoliviaBosnia and HerzegovinaBotswanaBrazilBrunei DarussalamBulgariaBurkina FasoBurundiCabo VerdeCambodiaCameroonCanadaCaribbean small statesCentral African RepublicCentral Europe and the BalticsChadChileChinaColombiaComorosCongo, Dem. Rep.Congo, Rep.Costa RicaCote d'IvoireCroatiaCubaCyprusCzech RepublicDenmarkDjiboutiDominicaDominican RepublicEarly-demographic dividendEast Asia & PacificEast Asia & Pacific (excluding high income)East Asia & Pacific (IDA & IBRD countries)EcuadorEgypt, Arab Rep.El SalvadorEquatorial GuineaEritreaEstoniaEthiopiaEuro areaEurope & Central AsiaEurope & Central Asia (excluding high income)Europe & Central Asia (IDA & IBRD countries)European UnionFaroe IslandsFijiFinlandFragile and conflict affected situationsFranceGabonGambia, TheGeorgiaGermanyGhanaGreeceGrenadaGuatemalaGuineaGuinea-BissauGuyanaHaitiHeavily indebted poor countries (HIPC)High incomeHondurasHong Kong SAR, ChinaHungaryIBRD onlyIcelandIDA & IBRD totalIDA blendIDA onlyIDA totalIndiaIndonesiaIran, Islamic Rep.IraqIrelandIsraelItalyJamaicaJapanJordanKazakhstanKenyaKiribatiKorea, Rep.KosovoKuwaitKyrgyz RepublicLao PDRLate-demographic dividendLatin America & Caribbean Latin America & Caribbean (excluding high income)Latin America & the Caribbean (IDA & IBRD countries)LatviaLeast developed countries: UN classificationLebanonLesothoLiberiaLibyaLithuaniaLow & middle incomeLow incomeLower middle incomeLuxembourgMacao SAR, ChinaMacedonia, FYRMadagascarMalawiMalaysiaMaldivesMaliMaltaMauritaniaMauritiusMexicoMicronesia, Fed. Sts.Middle East & North AfricaMiddle East & North Africa (excluding high income)Middle East & North Africa (IDA & IBRD countries)Middle incomeMoldovaMongoliaMontenegroMoroccoMozambiqueNamibiaNepalNetherlandsNew CaledoniaNew ZealandNicaraguaNigerNigeriaNorth AmericaNorwayOECD membersOmanOther small statesPacific island small statesPakistanPanamaPapua New GuineaParaguayPeruPhilippinesPolandPortugalPost-demographic dividendPre-demographic dividendPuerto RicoQatarRomaniaRussian FederationRwandaSaudi ArabiaSenegalSerbiaSeychellesSierra LeoneSingaporeSlovak RepublicSloveniaSmall statesSolomon IslandsSomaliaSouth AfricaSouth AsiaSouth Asia (IDA & IBRD)South SudanSpainSri LankaSt. Kitts and NevisSt. LuciaSt. Vincent and the GrenadinesSub-Saharan Africa Sub-Saharan Africa (excluding high income)Sub-Saharan Africa (IDA & IBRD countries)SudanSurinameSwazilandSwedenSwitzerlandSyrian Arab RepublicTajikistanTanzaniaThailandTimor-LesteTogoTongaTrinidad and TobagoTunisiaTurkeyTurkmenistanUgandaUkraineUnited Arab EmiratesUnited KingdomUnited StatesUpper middle incomeUruguayUzbekistanVanuatuVenezuela, RBVietnamWest Bank and GazaWorldYemen, Rep.ZambiaZimbabwe Timeline:
This timeline shows a graph from 1971 to 2016 of Guinea-Bissau. No data until 1970. Number of actual observations by date: 46.
Source name:
World Development Indicators
Source organization:
World Bank national accounts data, and OECD National Accounts data files.
Categories, topics:
Economy & Growth
Last updated:
apr 23, 2017
Indicators value changes by year
Minimum:
-17.415
jan 1, 1975
At the date of observation
Value
Absolute change
Change from previous value
jan 1, 1971
3.384
+3.384
0.0%
jan 1, 1972
-2.154
-5.538
-163.64%
jan 1, 1973
-8.522
-6.369
295.72%
jan 1, 1974
-13.777
-5.254
61.65%
jan 1, 1975
-17.415
-3.638
26.41%
jan 1, 1976
-5.364
+12.05
-69.2%
jan 1, 1977
-6.404
-1.04
19.38%
jan 1, 1978
-3.517
+2.887
-45.08%
jan 1, 1979
-6.623
-3.106
88.3%
jan 1, 1980
-12.417
-5.794
87.48%
jan 1, 1981
-0.973
+11.444
-92.16%
jan 1, 1982
1.22
+2.194
-225.37%
jan 1, 1983
-5.185
-6.406
-524.93%
jan 1, 1984
-3.583
+1.603
-30.91%
jan 1, 1985
-0.156
+3.427
-95.66%
jan 1, 1986
-12.851
-12.696
8.16K%
jan 1, 1987
-2.82
+10.031
-78.05%
jan 1, 1988
7.625
+10.446
-370.38%
jan 1, 1989
5.974
-1.651
-21.66%
jan 1, 1990
1.683
-4.291
-71.83%
jan 1, 1991
2.827
+1.144
67.98%
jan 1, 1992
3.181
+0.353
12.5%
jan 1, 1993
3.187
+0.007
0.21%
jan 1, 1994
7.01
+3.823
119.93%
jan 1, 1995
3.916
-3.094
-44.14%
jan 1, 1996
-1.175
-5.091
-130.01%
jan 1, 1997
1.741
+2.916
-248.14%
jan 1, 1998
5.133
+3.392
194.87%
jan 1, 1999
-10.064
-15.197
-296.07%
jan 1, 2000
-1.155
+8.909
-88.52%
jan 1, 2001
-6.89
-5.735
496.43%
jan 1, 2002
-1.527
+5.363
-77.83%
jan 1, 2003
0.089
+1.616
-105.82%
jan 1, 2004
0.583
+0.494
555.36%
jan 1, 2005
-2.827
-3.41
-584.91%
jan 1, 2006
-4.085
-1.258
44.5%
jan 1, 2007
-11.928
-7.843
191.98%
jan 1, 2008
-5.864
+6.064
-50.84%
jan 1, 2009
-6.876
-1.012
17.25%
jan 1, 2010
-10.239
-3.363
48.92%
jan 1, 2011
-8.782
+1.457
-14.23%
jan 1, 2012
1.302
+10.085
-114.83%
jan 1, 2013
-3.902
-5.205
-399.65%
jan 1, 2014
-0.737
+3.165
-81.1%
jan 1, 2015
-1.611
-0.874
118.5%
jan 1, 2016
6.196
+7.808
-484.56%
Ranking of countries by current statistics by years


Comments: