29
/
en
AIzaSyAYiBZKx7MnpbEhh9jyipgxe19OcubqV5w
April 1, 2024
73959
Austria
AUT
true
2
1
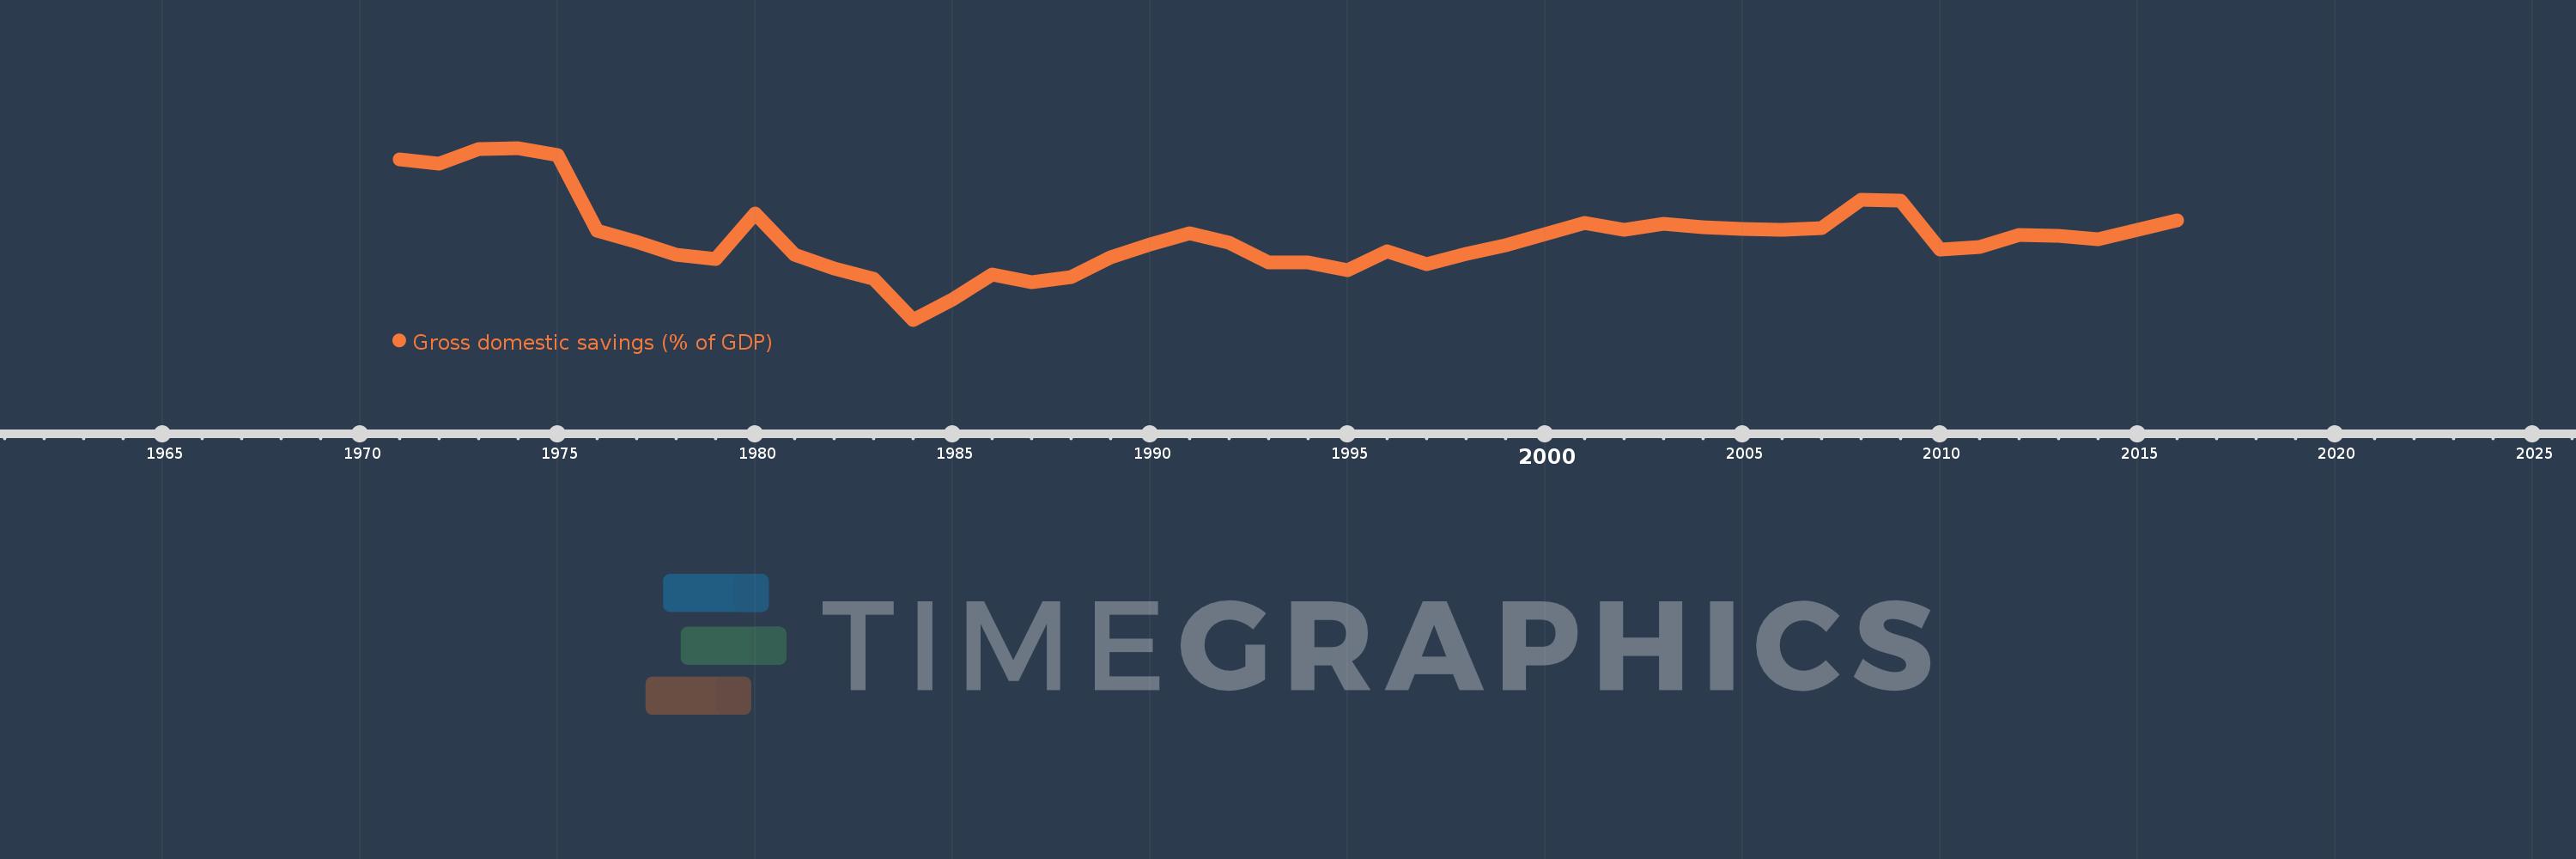
Gross domestic savings (% of GDP)
2016,2015,2014,2013,2012,2011,2010,2009,2008,2007,2006,2005,2004,2003,2002,2001,2000,1999,1998,1997,1996,1995,1994,1993,1992,1991,1990,1989,1988,1987,1986,1985,1984,1983,1982,1981,1980,1979,1978,1977,1976,1975,1974,1973,1972,1971
This statistics in other country:
AfghanistanAlbaniaAlgeriaAngolaAntigua and BarbudaArab WorldArgentinaArmeniaArubaAustraliaAustriaAzerbaijanBahamas, TheBahrainBangladeshBarbadosBelarusBelgiumBelizeBeninBermudaBhutanBoliviaBosnia and HerzegovinaBotswanaBrazilBrunei DarussalamBulgariaBurkina FasoBurundiCabo VerdeCambodiaCameroonCanadaCaribbean small statesCentral African RepublicCentral Europe and the BalticsChadChileChinaColombiaComorosCongo, Dem. Rep.Congo, Rep.Costa RicaCote d'IvoireCroatiaCubaCyprusCzech RepublicDenmarkDjiboutiDominicaDominican RepublicEarly-demographic dividendEast Asia & PacificEast Asia & Pacific (excluding high income)East Asia & Pacific (IDA & IBRD countries)EcuadorEgypt, Arab Rep.El SalvadorEquatorial GuineaEritreaEstoniaEthiopiaEuro areaEurope & Central AsiaEurope & Central Asia (excluding high income)Europe & Central Asia (IDA & IBRD countries)European UnionFaroe IslandsFijiFinlandFragile and conflict affected situationsFranceGabonGambia, TheGeorgiaGermanyGhanaGreeceGrenadaGuatemalaGuineaGuinea-BissauGuyanaHaitiHeavily indebted poor countries (HIPC)High incomeHondurasHong Kong SAR, ChinaHungaryIBRD onlyIcelandIDA & IBRD totalIDA blendIDA onlyIDA totalIndiaIndonesiaIran, Islamic Rep.IraqIrelandIsraelItalyJamaicaJapanJordanKazakhstanKenyaKiribatiKorea, Rep.KosovoKuwaitKyrgyz RepublicLao PDRLate-demographic dividendLatin America & Caribbean Latin America & Caribbean (excluding high income)Latin America & the Caribbean (IDA & IBRD countries)LatviaLeast developed countries: UN classificationLebanonLesothoLiberiaLibyaLithuaniaLow & middle incomeLow incomeLower middle incomeLuxembourgMacao SAR, ChinaMacedonia, FYRMadagascarMalawiMalaysiaMaldivesMaliMaltaMauritaniaMauritiusMexicoMicronesia, Fed. Sts.Middle East & North AfricaMiddle East & North Africa (excluding high income)Middle East & North Africa (IDA & IBRD countries)Middle incomeMoldovaMongoliaMontenegroMoroccoMozambiqueNamibiaNepalNetherlandsNew CaledoniaNew ZealandNicaraguaNigerNigeriaNorth AmericaNorwayOECD membersOmanOther small statesPacific island small statesPakistanPanamaPapua New GuineaParaguayPeruPhilippinesPolandPortugalPost-demographic dividendPre-demographic dividendPuerto RicoQatarRomaniaRussian FederationRwandaSaudi ArabiaSenegalSerbiaSeychellesSierra LeoneSingaporeSlovak RepublicSloveniaSmall statesSolomon IslandsSomaliaSouth AfricaSouth AsiaSouth Asia (IDA & IBRD)South SudanSpainSri LankaSt. Kitts and NevisSt. LuciaSt. Vincent and the GrenadinesSub-Saharan Africa Sub-Saharan Africa (excluding high income)Sub-Saharan Africa (IDA & IBRD countries)SudanSurinameSwazilandSwedenSwitzerlandSyrian Arab RepublicTajikistanTanzaniaThailandTimor-LesteTogoTongaTrinidad and TobagoTunisiaTurkeyTurkmenistanUgandaUkraineUnited Arab EmiratesUnited KingdomUnited StatesUpper middle incomeUruguayUzbekistanVanuatuVenezuela, RBVietnamWest Bank and GazaWorldYemen, Rep.ZambiaZimbabwe Timeline:
This timeline shows a graph from 1971 to 2016 of Austria. No data until 1970. Number of actual observations by date: 46.
Source name:
World Development Indicators
Source organization:
World Bank national accounts data, and OECD National Accounts data files.
Categories, topics:
Economy & Growth
Last updated:
apr 23, 2017
Indicators value changes by year
Minimum:
21.667
jan 1, 1984
Maximum:
31.812
jan 1, 1974
At the date of observation
Value
Absolute change
Change from previous value
jan 1, 1971
31.142
+31.142
0.0%
jan 1, 1972
30.902
-0.24
-0.77%
jan 1, 1973
31.748
+0.847
2.74%
jan 1, 1974
31.812
+0.063
0.2%
jan 1, 1975
31.373
-0.439
-1.38%
jan 1, 1976
26.91
-4.463
-14.23%
jan 1, 1977
26.266
-0.644
-2.39%
jan 1, 1978
25.499
-0.767
-2.92%
jan 1, 1979
25.247
-0.252
-0.99%
jan 1, 1980
27.962
+2.715
10.75%
jan 1, 1981
25.51
-2.452
-8.77%
jan 1, 1982
24.692
-0.817
-3.2%
jan 1, 1983
24.097
-0.595
-2.41%
jan 1, 1984
21.667
-2.43
-10.08%
jan 1, 1985
22.849
+1.182
5.45%
jan 1, 1986
24.362
+1.513
6.62%
jan 1, 1987
23.862
-0.5
-2.05%
jan 1, 1988
24.165
+0.303
1.27%
jan 1, 1989
25.341
+1.176
4.87%
jan 1, 1990
26.126
+0.785
3.1%
jan 1, 1991
26.761
+0.636
2.43%
jan 1, 1992
26.195
-0.567
-2.12%
jan 1, 1993
25.042
-1.152
-4.4%
jan 1, 1994
25.063
+0.021
0.08%
jan 1, 1995
24.569
-0.494
-1.97%
jan 1, 1996
25.735
+1.166
4.75%
jan 1, 1997
24.927
-0.809
-3.14%
jan 1, 1998
25.549
+0.623
2.5%
jan 1, 1999
26.042
+0.493
1.93%
jan 1, 2000
26.704
+0.662
2.54%
jan 1, 2001
27.395
+0.691
2.59%
jan 1, 2002
26.953
-0.442
-1.61%
jan 1, 2003
27.326
+0.373
1.38%
jan 1, 2004
27.141
-0.185
-0.68%
jan 1, 2005
27.01
-0.131
-0.48%
jan 1, 2006
26.985
-0.024
-0.09%
jan 1, 2007
27.103
+0.118
0.44%
jan 1, 2008
28.772
+1.668
6.16%
jan 1, 2009
28.72
-0.051
-0.18%
jan 1, 2010
25.829
-2.891
-10.07%
jan 1, 2011
25.978
+0.149
0.57%
jan 1, 2012
26.695
+0.717
2.76%
jan 1, 2013
26.613
-0.082
-0.31%
jan 1, 2014
26.417
-0.197
-0.74%
jan 1, 2015
26.956
+0.539
2.04%
jan 1, 2016
27.515
+0.559
2.08%
Ranking of countries by current statistics by years


Comments: