29
/
en
AIzaSyAYiBZKx7MnpbEhh9jyipgxe19OcubqV5w
April 1, 2024
60796
Sub-Saharan Africa (IDA & IBRD countries)
TSS
false
2
1
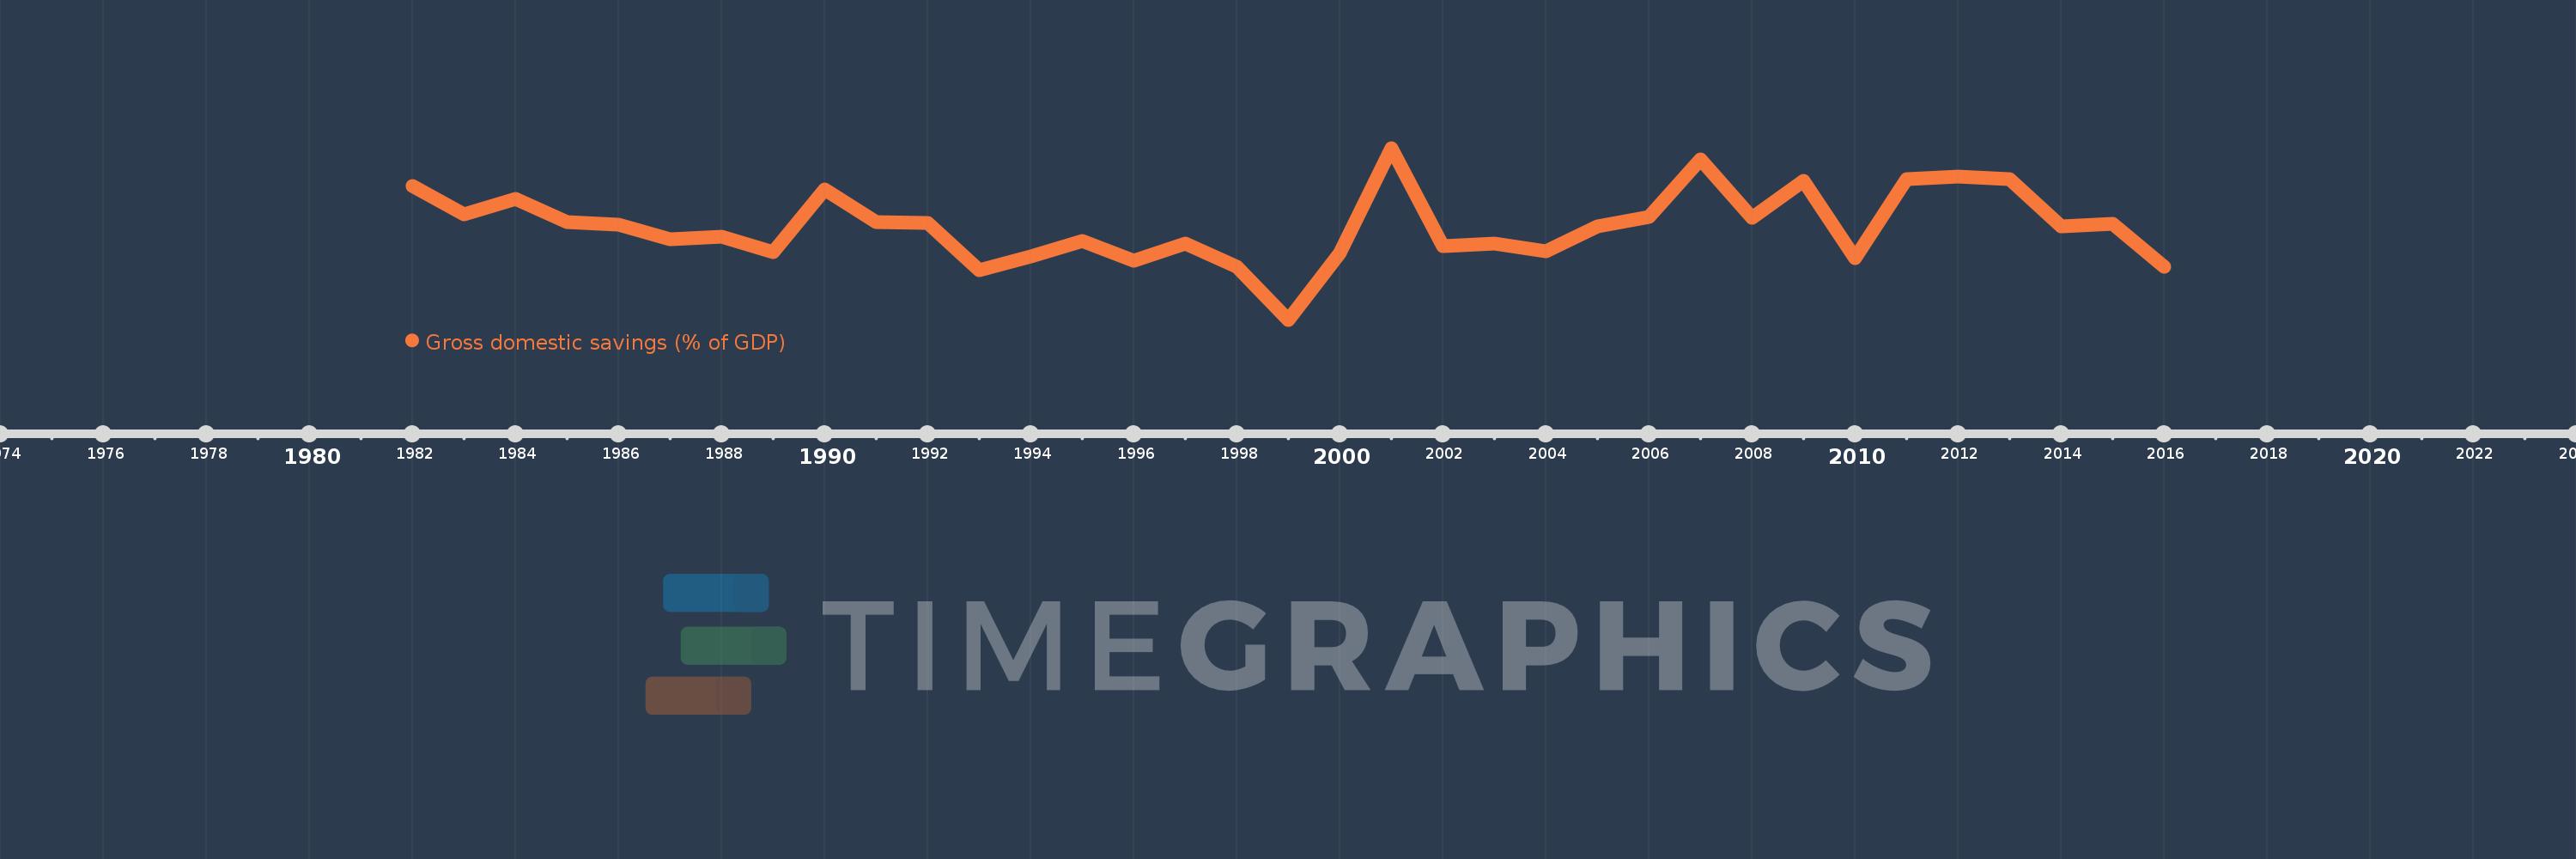
Gross domestic savings (% of GDP)
2016,2015,2014,2013,2012,2011,2010,2009,2008,2007,2006,2005,2004,2003,2002,2001,2000,1999,1998,1997,1996,1995,1994,1993,1992,1991,1990,1989,1988,1987,1986,1985,1984,1983,1982
This statistics in other country:
AfghanistanAlbaniaAlgeriaAngolaAntigua and BarbudaArab WorldArgentinaArmeniaArubaAustraliaAustriaAzerbaijanBahamas, TheBahrainBangladeshBarbadosBelarusBelgiumBelizeBeninBermudaBhutanBoliviaBosnia and HerzegovinaBotswanaBrazilBrunei DarussalamBulgariaBurkina FasoBurundiCabo VerdeCambodiaCameroonCanadaCaribbean small statesCentral African RepublicCentral Europe and the BalticsChadChileChinaColombiaComorosCongo, Dem. Rep.Congo, Rep.Costa RicaCote d'IvoireCroatiaCubaCyprusCzech RepublicDenmarkDjiboutiDominicaDominican RepublicEarly-demographic dividendEast Asia & PacificEast Asia & Pacific (excluding high income)East Asia & Pacific (IDA & IBRD countries)EcuadorEgypt, Arab Rep.El SalvadorEquatorial GuineaEritreaEstoniaEthiopiaEuro areaEurope & Central AsiaEurope & Central Asia (excluding high income)Europe & Central Asia (IDA & IBRD countries)European UnionFaroe IslandsFijiFinlandFragile and conflict affected situationsFranceGabonGambia, TheGeorgiaGermanyGhanaGreeceGrenadaGuatemalaGuineaGuinea-BissauGuyanaHaitiHeavily indebted poor countries (HIPC)High incomeHondurasHong Kong SAR, ChinaHungaryIBRD onlyIcelandIDA & IBRD totalIDA blendIDA onlyIDA totalIndiaIndonesiaIran, Islamic Rep.IraqIrelandIsraelItalyJamaicaJapanJordanKazakhstanKenyaKiribatiKorea, Rep.KosovoKuwaitKyrgyz RepublicLao PDRLate-demographic dividendLatin America & Caribbean Latin America & Caribbean (excluding high income)Latin America & the Caribbean (IDA & IBRD countries)LatviaLeast developed countries: UN classificationLebanonLesothoLiberiaLibyaLithuaniaLow & middle incomeLow incomeLower middle incomeLuxembourgMacao SAR, ChinaMacedonia, FYRMadagascarMalawiMalaysiaMaldivesMaliMaltaMauritaniaMauritiusMexicoMicronesia, Fed. Sts.Middle East & North AfricaMiddle East & North Africa (excluding high income)Middle East & North Africa (IDA & IBRD countries)Middle incomeMoldovaMongoliaMontenegroMoroccoMozambiqueNamibiaNepalNetherlandsNew CaledoniaNew ZealandNicaraguaNigerNigeriaNorth AmericaNorwayOECD membersOmanOther small statesPacific island small statesPakistanPanamaPapua New GuineaParaguayPeruPhilippinesPolandPortugalPost-demographic dividendPre-demographic dividendPuerto RicoQatarRomaniaRussian FederationRwandaSaudi ArabiaSenegalSerbiaSeychellesSierra LeoneSingaporeSlovak RepublicSloveniaSmall statesSolomon IslandsSomaliaSouth AfricaSouth AsiaSouth Asia (IDA & IBRD)South SudanSpainSri LankaSt. Kitts and NevisSt. LuciaSt. Vincent and the GrenadinesSub-Saharan Africa Sub-Saharan Africa (excluding high income)Sub-Saharan Africa (IDA & IBRD countries)SudanSurinameSwazilandSwedenSwitzerlandSyrian Arab RepublicTajikistanTanzaniaThailandTimor-LesteTogoTongaTrinidad and TobagoTunisiaTurkeyTurkmenistanUgandaUkraineUnited Arab EmiratesUnited KingdomUnited StatesUpper middle incomeUruguayUzbekistanVanuatuVenezuela, RBVietnamWest Bank and GazaWorldYemen, Rep.ZambiaZimbabwe Timeline:
This timeline shows a graph from 1982 to 2016 of Sub-Saharan Africa (IDA & IBRD countries). No data until 1981. Number of actual observations by date: 35.
Source name:
World Development Indicators
Source organization:
World Bank national accounts data, and OECD National Accounts data files.
Categories, topics:
Economy & Growth
Last updated:
apr 23, 2017
Indicators value changes by year
Minimum:
11.668
jan 1, 1999
Maximum:
23.771
jan 1, 2001
At the date of observation
Value
Absolute change
Change from previous value
jan 1, 1982
21.076
+21.076
0.0%
jan 1, 1983
19.064
-2.012
-9.55%
jan 1, 1984
20.198
+1.133
5.95%
jan 1, 1985
18.542
-1.656
-8.2%
jan 1, 1986
18.386
-0.155
-0.84%
jan 1, 1987
17.336
-1.05
-5.71%
jan 1, 1988
17.524
+0.188
1.08%
jan 1, 1989
16.445
-1.079
-6.16%
jan 1, 1990
20.84
+4.395
26.73%
jan 1, 1991
18.522
-2.318
-11.12%
jan 1, 1992
18.486
-0.037
-0.2%
jan 1, 1993
15.165
-3.321
-17.97%
jan 1, 1994
16.106
+0.941
6.21%
jan 1, 1995
17.187
+1.081
6.71%
jan 1, 1996
15.843
-1.344
-7.82%
jan 1, 1997
17.033
+1.19
7.51%
jan 1, 1998
15.398
-1.635
-9.6%
jan 1, 1999
11.668
-3.73
-24.23%
jan 1, 2000
16.357
+4.69
40.19%
jan 1, 2001
23.771
+7.413
45.32%
jan 1, 2002
16.832
-6.939
-29.19%
jan 1, 2003
17.016
+0.184
1.09%
jan 1, 2004
16.515
-0.501
-2.95%
jan 1, 2005
18.237
+1.723
10.43%
jan 1, 2006
18.896
+0.659
3.61%
jan 1, 2007
22.963
+4.066
21.52%
jan 1, 2008
18.824
-4.138
-18.02%
jan 1, 2009
21.466
+2.642
14.03%
jan 1, 2010
16.021
-5.446
-25.37%
jan 1, 2011
21.602
+5.582
34.84%
jan 1, 2012
21.726
+0.124
0.57%
jan 1, 2013
21.589
-0.137
-0.63%
jan 1, 2014
18.231
-3.358
-15.55%
jan 1, 2015
18.437
+0.206
1.13%
jan 1, 2016
15.381
-3.056
-16.58%
Ranking of countries by current statistics by years


Comments: