29
/
en
AIzaSyAYiBZKx7MnpbEhh9jyipgxe19OcubqV5w
April 1, 2024
38190
IDA blend
IDB
false
2
1
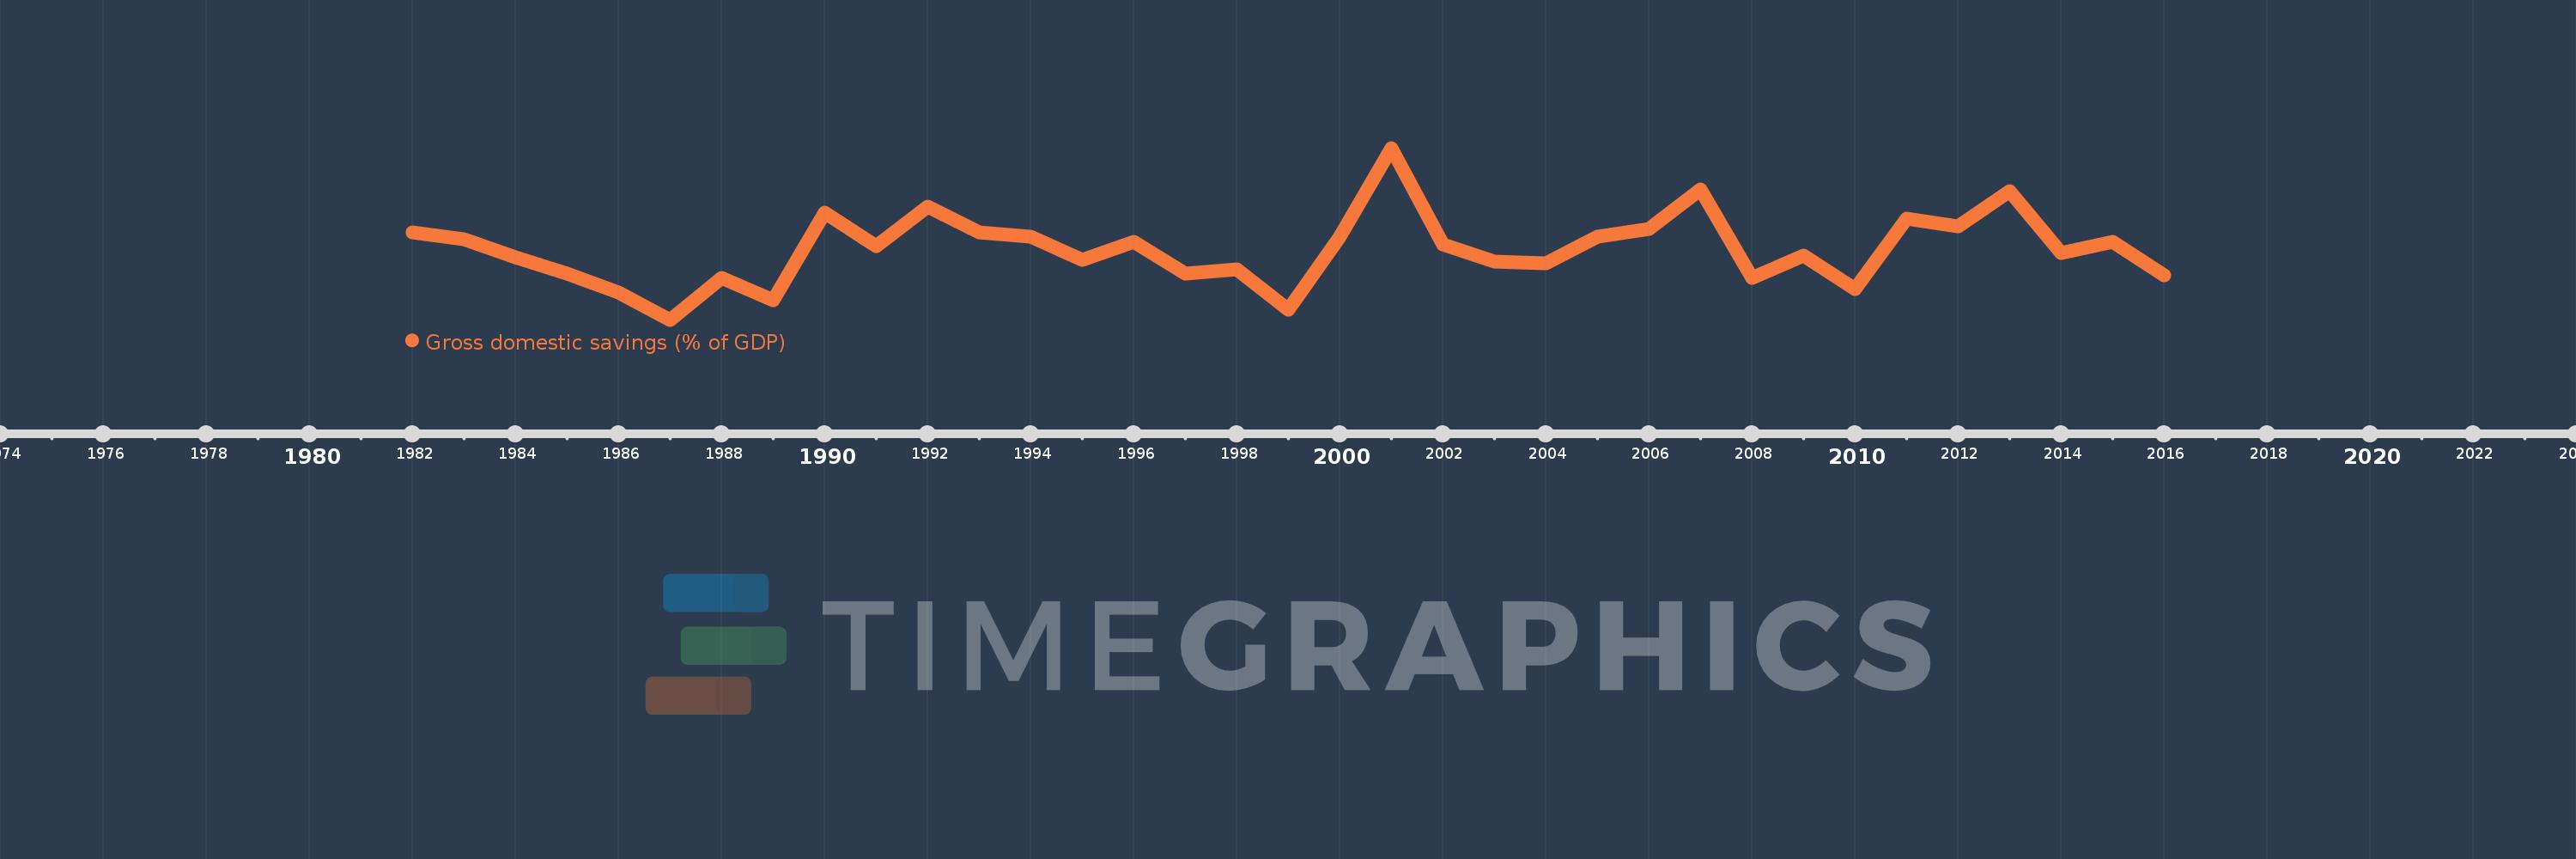
Gross domestic savings (% of GDP)
2016,2015,2014,2013,2012,2011,2010,2009,2008,2007,2006,2005,2004,2003,2002,2001,2000,1999,1998,1997,1996,1995,1994,1993,1992,1991,1990,1989,1988,1987,1986,1985,1984,1983,1982
This statistics in other country:
AfghanistanAlbaniaAlgeriaAngolaAntigua and BarbudaArab WorldArgentinaArmeniaArubaAustraliaAustriaAzerbaijanBahamas, TheBahrainBangladeshBarbadosBelarusBelgiumBelizeBeninBermudaBhutanBoliviaBosnia and HerzegovinaBotswanaBrazilBrunei DarussalamBulgariaBurkina FasoBurundiCabo VerdeCambodiaCameroonCanadaCaribbean small statesCentral African RepublicCentral Europe and the BalticsChadChileChinaColombiaComorosCongo, Dem. Rep.Congo, Rep.Costa RicaCote d'IvoireCroatiaCubaCyprusCzech RepublicDenmarkDjiboutiDominicaDominican RepublicEarly-demographic dividendEast Asia & PacificEast Asia & Pacific (excluding high income)East Asia & Pacific (IDA & IBRD countries)EcuadorEgypt, Arab Rep.El SalvadorEquatorial GuineaEritreaEstoniaEthiopiaEuro areaEurope & Central AsiaEurope & Central Asia (excluding high income)Europe & Central Asia (IDA & IBRD countries)European UnionFaroe IslandsFijiFinlandFragile and conflict affected situationsFranceGabonGambia, TheGeorgiaGermanyGhanaGreeceGrenadaGuatemalaGuineaGuinea-BissauGuyanaHaitiHeavily indebted poor countries (HIPC)High incomeHondurasHong Kong SAR, ChinaHungaryIBRD onlyIcelandIDA & IBRD totalIDA blendIDA onlyIDA totalIndiaIndonesiaIran, Islamic Rep.IraqIrelandIsraelItalyJamaicaJapanJordanKazakhstanKenyaKiribatiKorea, Rep.KosovoKuwaitKyrgyz RepublicLao PDRLate-demographic dividendLatin America & Caribbean Latin America & Caribbean (excluding high income)Latin America & the Caribbean (IDA & IBRD countries)LatviaLeast developed countries: UN classificationLebanonLesothoLiberiaLibyaLithuaniaLow & middle incomeLow incomeLower middle incomeLuxembourgMacao SAR, ChinaMacedonia, FYRMadagascarMalawiMalaysiaMaldivesMaliMaltaMauritaniaMauritiusMexicoMicronesia, Fed. Sts.Middle East & North AfricaMiddle East & North Africa (excluding high income)Middle East & North Africa (IDA & IBRD countries)Middle incomeMoldovaMongoliaMontenegroMoroccoMozambiqueNamibiaNepalNetherlandsNew CaledoniaNew ZealandNicaraguaNigerNigeriaNorth AmericaNorwayOECD membersOmanOther small statesPacific island small statesPakistanPanamaPapua New GuineaParaguayPeruPhilippinesPolandPortugalPost-demographic dividendPre-demographic dividendPuerto RicoQatarRomaniaRussian FederationRwandaSaudi ArabiaSenegalSerbiaSeychellesSierra LeoneSingaporeSlovak RepublicSloveniaSmall statesSolomon IslandsSomaliaSouth AfricaSouth AsiaSouth Asia (IDA & IBRD)South SudanSpainSri LankaSt. Kitts and NevisSt. LuciaSt. Vincent and the GrenadinesSub-Saharan Africa Sub-Saharan Africa (excluding high income)Sub-Saharan Africa (IDA & IBRD countries)SudanSurinameSwazilandSwedenSwitzerlandSyrian Arab RepublicTajikistanTanzaniaThailandTimor-LesteTogoTongaTrinidad and TobagoTunisiaTurkeyTurkmenistanUgandaUkraineUnited Arab EmiratesUnited KingdomUnited StatesUpper middle incomeUruguayUzbekistanVanuatuVenezuela, RBVietnamWest Bank and GazaWorldYemen, Rep.ZambiaZimbabwe Timeline:
This timeline shows a graph from 1982 to 2016 of IDA blend. No data until 1981. Number of actual observations by date: 35.
Source name:
World Development Indicators
Source organization:
World Bank national accounts data, and OECD National Accounts data files.
Categories, topics:
Economy & Growth
Last updated:
apr 23, 2017
Indicators value changes by year
Minimum:
12.569
jan 1, 1987
Maximum:
25.703
jan 1, 2001
At the date of observation
Value
Absolute change
Change from previous value
jan 1, 1982
19.238
+19.238
0.0%
jan 1, 1983
18.741
-0.498
-2.59%
jan 1, 1984
17.313
-1.427
-7.62%
jan 1, 1985
16.093
-1.221
-7.05%
jan 1, 1986
14.682
-1.41
-8.76%
jan 1, 1987
12.569
-2.114
-14.4%
jan 1, 1988
15.738
+3.169
25.22%
jan 1, 1989
14.047
-1.691
-10.75%
jan 1, 1990
20.787
+6.74
47.98%
jan 1, 1991
18.169
-2.617
-12.59%
jan 1, 1992
21.188
+3.018
16.61%
jan 1, 1993
19.264
-1.924
-9.08%
jan 1, 1994
18.888
-0.376
-1.95%
jan 1, 1995
17.148
-1.74
-9.21%
jan 1, 1996
18.535
+1.387
8.09%
jan 1, 1997
16.082
-2.453
-13.23%
jan 1, 1998
16.43
+0.348
2.16%
jan 1, 1999
13.323
-3.107
-18.91%
jan 1, 2000
18.903
+5.58
41.88%
jan 1, 2001
25.703
+6.8
35.98%
jan 1, 2002
18.309
-7.394
-28.77%
jan 1, 2003
17.031
-1.278
-6.98%
jan 1, 2004
16.851
-0.18
-1.06%
jan 1, 2005
18.928
+2.077
12.33%
jan 1, 2006
19.492
+0.564
2.98%
jan 1, 2007
22.523
+3.031
15.55%
jan 1, 2008
15.737
-6.786
-30.13%
jan 1, 2009
17.475
+1.738
11.04%
jan 1, 2010
14.915
-2.56
-14.65%
jan 1, 2011
20.269
+5.354
35.9%
jan 1, 2012
19.699
-0.57
-2.81%
jan 1, 2013
22.428
+2.729
13.85%
jan 1, 2014
17.693
-4.736
-21.11%
jan 1, 2015
18.548
+0.855
4.83%
jan 1, 2016
15.981
-2.566
-13.84%
Ranking of countries by current statistics by years


Comments: