29
/
en
AIzaSyAYiBZKx7MnpbEhh9jyipgxe19OcubqV5w
April 1, 2024
202970
Mozambique
MOZ
true
2
1
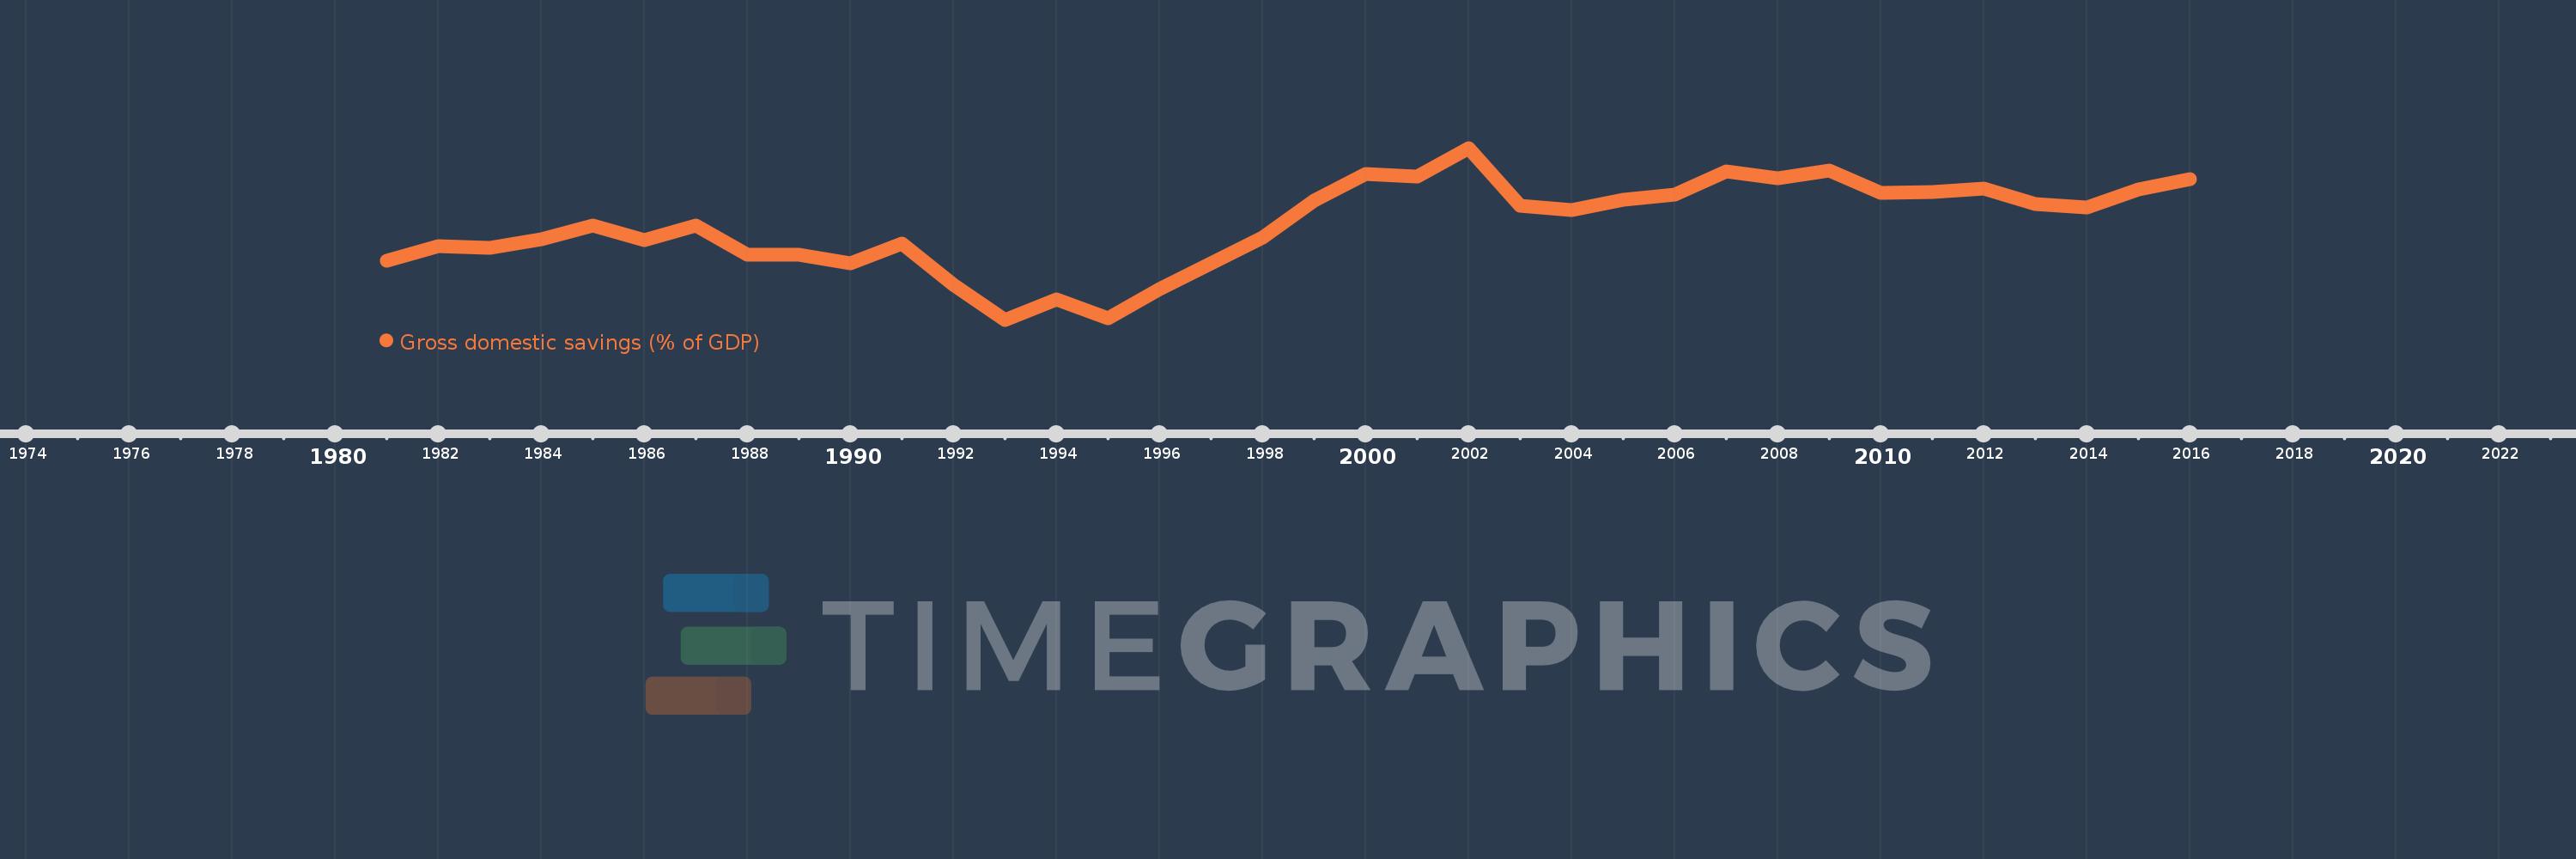
Gross domestic savings (% of GDP)
2016,2015,2014,2013,2012,2011,2010,2009,2008,2007,2006,2005,2004,2003,2002,2001,2000,1999,1998,1997,1996,1995,1994,1993,1992,1991,1990,1989,1988,1987,1986,1985,1984,1983,1982,1981
This statistics in other country:
AfghanistanAlbaniaAlgeriaAngolaAntigua and BarbudaArab WorldArgentinaArmeniaArubaAustraliaAustriaAzerbaijanBahamas, TheBahrainBangladeshBarbadosBelarusBelgiumBelizeBeninBermudaBhutanBoliviaBosnia and HerzegovinaBotswanaBrazilBrunei DarussalamBulgariaBurkina FasoBurundiCabo VerdeCambodiaCameroonCanadaCaribbean small statesCentral African RepublicCentral Europe and the BalticsChadChileChinaColombiaComorosCongo, Dem. Rep.Congo, Rep.Costa RicaCote d'IvoireCroatiaCubaCyprusCzech RepublicDenmarkDjiboutiDominicaDominican RepublicEarly-demographic dividendEast Asia & PacificEast Asia & Pacific (excluding high income)East Asia & Pacific (IDA & IBRD countries)EcuadorEgypt, Arab Rep.El SalvadorEquatorial GuineaEritreaEstoniaEthiopiaEuro areaEurope & Central AsiaEurope & Central Asia (excluding high income)Europe & Central Asia (IDA & IBRD countries)European UnionFaroe IslandsFijiFinlandFragile and conflict affected situationsFranceGabonGambia, TheGeorgiaGermanyGhanaGreeceGrenadaGuatemalaGuineaGuinea-BissauGuyanaHaitiHeavily indebted poor countries (HIPC)High incomeHondurasHong Kong SAR, ChinaHungaryIBRD onlyIcelandIDA & IBRD totalIDA blendIDA onlyIDA totalIndiaIndonesiaIran, Islamic Rep.IraqIrelandIsraelItalyJamaicaJapanJordanKazakhstanKenyaKiribatiKorea, Rep.KosovoKuwaitKyrgyz RepublicLao PDRLate-demographic dividendLatin America & Caribbean Latin America & Caribbean (excluding high income)Latin America & the Caribbean (IDA & IBRD countries)LatviaLeast developed countries: UN classificationLebanonLesothoLiberiaLibyaLithuaniaLow & middle incomeLow incomeLower middle incomeLuxembourgMacao SAR, ChinaMacedonia, FYRMadagascarMalawiMalaysiaMaldivesMaliMaltaMauritaniaMauritiusMexicoMicronesia, Fed. Sts.Middle East & North AfricaMiddle East & North Africa (excluding high income)Middle East & North Africa (IDA & IBRD countries)Middle incomeMoldovaMongoliaMontenegroMoroccoMozambiqueNamibiaNepalNetherlandsNew CaledoniaNew ZealandNicaraguaNigerNigeriaNorth AmericaNorwayOECD membersOmanOther small statesPacific island small statesPakistanPanamaPapua New GuineaParaguayPeruPhilippinesPolandPortugalPost-demographic dividendPre-demographic dividendPuerto RicoQatarRomaniaRussian FederationRwandaSaudi ArabiaSenegalSerbiaSeychellesSierra LeoneSingaporeSlovak RepublicSloveniaSmall statesSolomon IslandsSomaliaSouth AfricaSouth AsiaSouth Asia (IDA & IBRD)South SudanSpainSri LankaSt. Kitts and NevisSt. LuciaSt. Vincent and the GrenadinesSub-Saharan Africa Sub-Saharan Africa (excluding high income)Sub-Saharan Africa (IDA & IBRD countries)SudanSurinameSwazilandSwedenSwitzerlandSyrian Arab RepublicTajikistanTanzaniaThailandTimor-LesteTogoTongaTrinidad and TobagoTunisiaTurkeyTurkmenistanUgandaUkraineUnited Arab EmiratesUnited KingdomUnited StatesUpper middle incomeUruguayUzbekistanVanuatuVenezuela, RBVietnamWest Bank and GazaWorldYemen, Rep.ZambiaZimbabwe Timeline:
This timeline shows a graph from 1981 to 2016 of Mozambique. No data until 1980. Number of actual observations by date: 36.
Source name:
World Development Indicators
Source organization:
World Bank national accounts data, and OECD National Accounts data files.
Categories, topics:
Economy & Growth
Last updated:
apr 23, 2017
Indicators value changes by year
Minimum:
-19.591
jan 1, 1993
Maximum:
11.544
jan 1, 2002
At the date of observation
Value
Absolute change
Change from previous value
jan 1, 1981
-8.865
-8.865
0.0%
jan 1, 1982
-6.276
+2.589
-29.2%
jan 1, 1983
-6.517
-0.24
3.82%
jan 1, 1984
-5.046
+1.47
-22.56%
jan 1, 1985
-2.531
+2.515
-49.84%
jan 1, 1986
-5.15
-2.618
103.43%
jan 1, 1987
-2.476
+2.674
-51.93%
jan 1, 1988
-7.73
-5.254
212.24%
jan 1, 1989
-7.8
-0.071
0.91%
jan 1, 1990
-9.42
-1.62
20.76%
jan 1, 1991
-5.826
+3.594
-38.15%
jan 1, 1992
-13.259
-7.433
127.57%
jan 1, 1993
-19.591
-6.332
47.75%
jan 1, 1994
-15.965
+3.626
-18.51%
jan 1, 1995
-19.344
-3.378
21.16%
jan 1, 1996
-13.979
+5.365
-27.73%
jan 1, 1997
-9.344
+4.635
-33.16%
jan 1, 1998
-4.685
+4.659
-49.86%
jan 1, 1999
2.0
+6.685
-142.69%
jan 1, 2000
6.899
+4.899
244.92%
jan 1, 2001
6.405
-0.494
-7.15%
jan 1, 2002
11.544
+5.139
80.23%
jan 1, 2003
1.011
-10.533
-91.24%
jan 1, 2004
0.319
-0.692
-68.41%
jan 1, 2005
2.192
+1.873
586.1%
jan 1, 2006
3.035
+0.843
38.47%
jan 1, 2007
7.226
+4.191
138.07%
jan 1, 2008
6.056
-1.17
-16.2%
jan 1, 2009
7.415
+1.359
22.45%
jan 1, 2010
3.379
-4.037
-54.44%
jan 1, 2011
3.584
+0.206
6.09%
jan 1, 2012
4.186
+0.602
16.79%
jan 1, 2013
1.304
-2.882
-68.84%
jan 1, 2014
0.832
-0.473
-36.25%
jan 1, 2015
3.959
+3.127
376.06%
jan 1, 2016
5.922
+1.963
49.59%
Ranking of countries by current statistics by years


Comments: