29
/
en
AIzaSyAYiBZKx7MnpbEhh9jyipgxe19OcubqV5w
April 1, 2024
92645
Brunei Darussalam
BRN
true
2
1
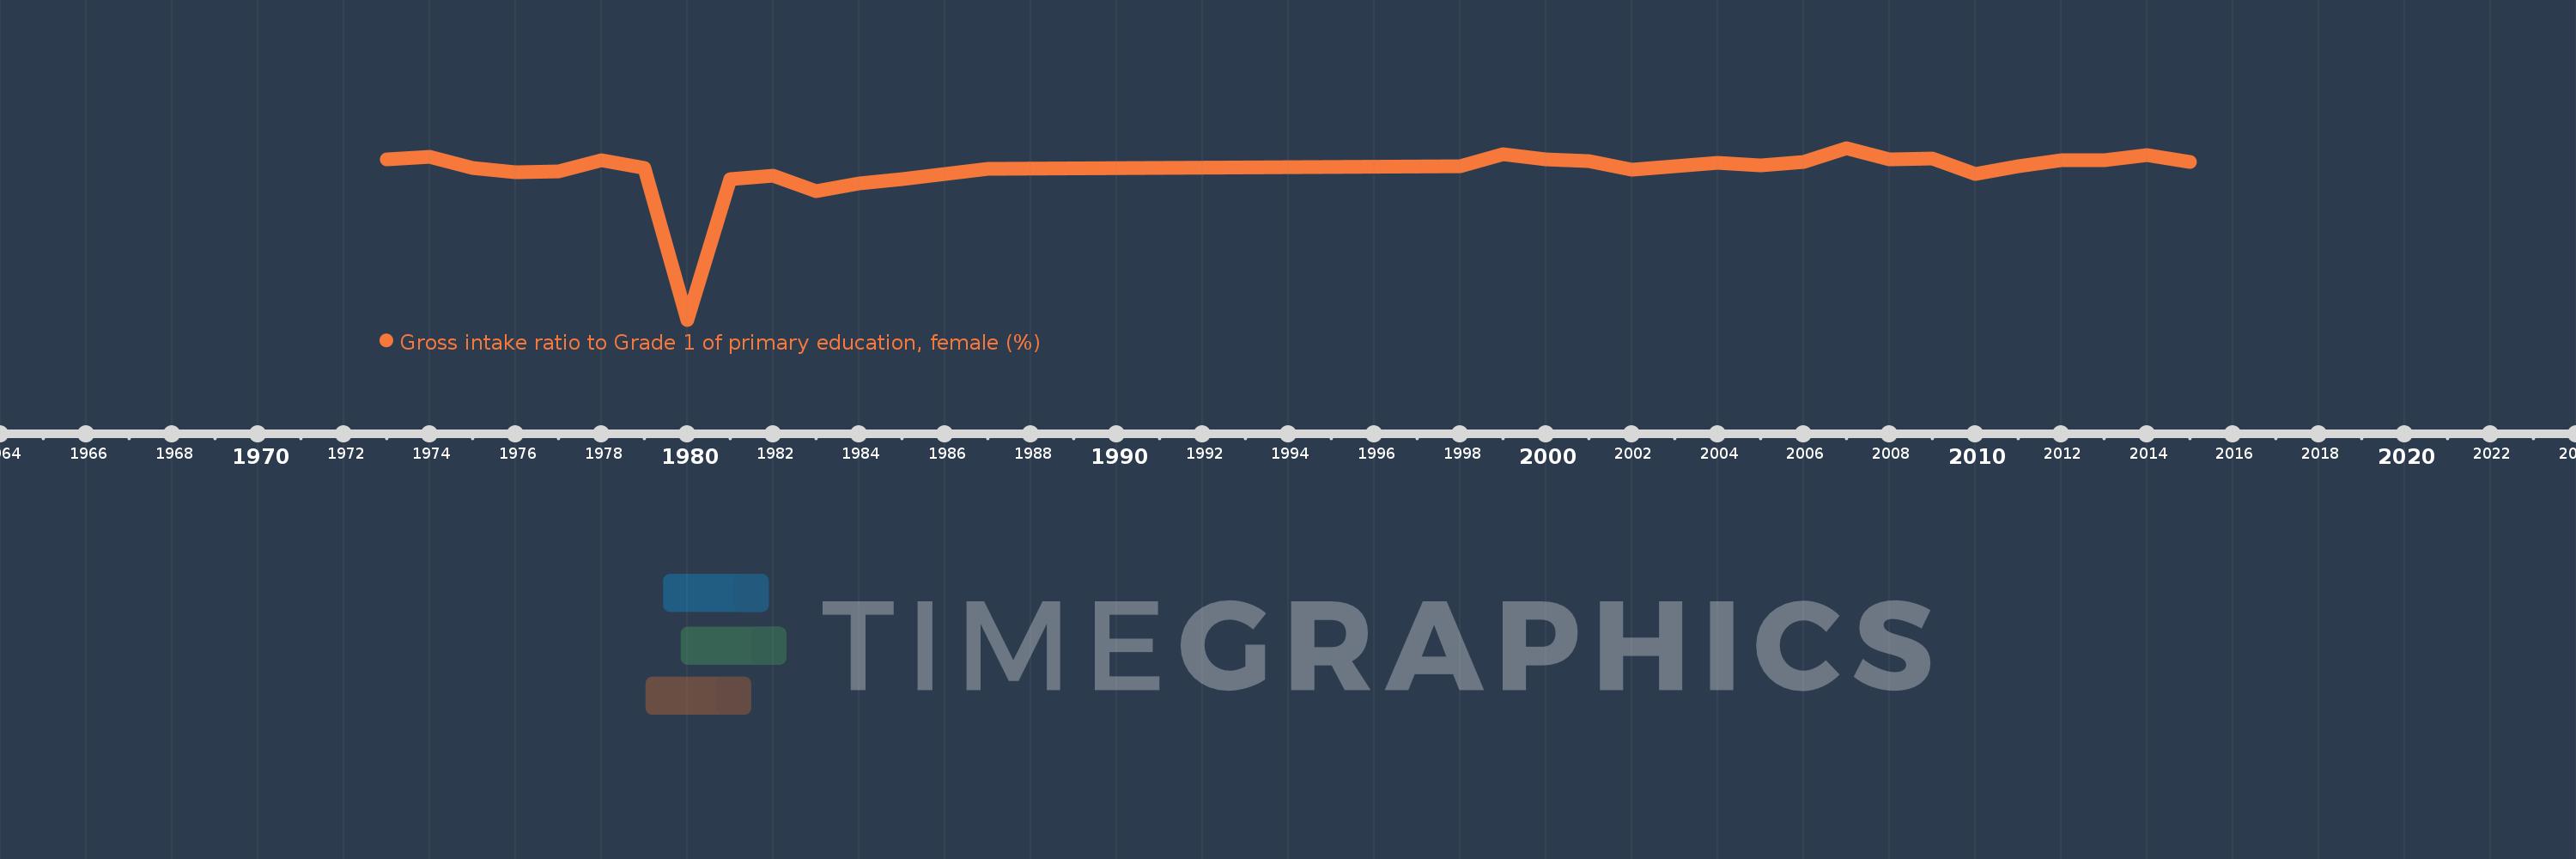
Gross intake ratio to Grade 1 of primary education, female (%)
2015,2014,2013,2012,2011,2010,2009,2008,2007,2006,2005,2004,2003,2002,2001,2000,1999,1998,1987,1985,1984,1983,1982,1981,1980,1979,1978,1977,1976,1975,1974,1973
This statistics in other country:
AfghanistanAlbaniaAlgeriaAngolaAntigua and BarbudaArab WorldArgentinaArmeniaArubaAustriaAzerbaijanBahamas, TheBahrainBangladeshBarbadosBelarusBelgiumBelizeBeninBermudaBhutanBoliviaBosnia and HerzegovinaBotswanaBrazilBrunei DarussalamBulgariaBurkina FasoBurundiCabo VerdeCambodiaCameroonCanadaCaribbean small statesCentral African RepublicCentral Europe and the BalticsChadChileChinaColombiaComorosCongo, Dem. Rep.Congo, Rep.Costa RicaCote d'IvoireCroatiaCubaCyprusCzech RepublicDenmarkDjiboutiDominicaDominican RepublicEarly-demographic dividendEast Asia & PacificEast Asia & Pacific (excluding high income)East Asia & Pacific (IDA & IBRD countries)EcuadorEgypt, Arab Rep.El SalvadorEquatorial GuineaEritreaEstoniaEthiopiaEuro areaEurope & Central AsiaEurope & Central Asia (excluding high income)Europe & Central Asia (IDA & IBRD countries)European UnionFijiFinlandFragile and conflict affected situationsFranceGabonGambia, TheGeorgiaGermanyGhanaGreeceGrenadaGuatemalaGuineaGuinea-BissauGuyanaHaitiHeavily indebted poor countries (HIPC)High incomeHondurasHong Kong SAR, ChinaHungaryIBRD onlyIcelandIDA & IBRD totalIDA blendIDA onlyIDA totalIndiaIndonesiaIran, Islamic Rep.IraqIrelandIsraelItalyJamaicaJapanJordanKazakhstanKenyaKiribatiKorea, Dem. People’s Rep.Korea, Rep.KuwaitKyrgyz RepublicLao PDRLate-demographic dividendLatin America & Caribbean Latin America & Caribbean (excluding high income)Latin America & the Caribbean (IDA & IBRD countries)LatviaLeast developed countries: UN classificationLebanonLesothoLiberiaLibyaLiechtensteinLithuaniaLow & middle incomeLow incomeLower middle incomeLuxembourgMacao SAR, ChinaMacedonia, FYRMadagascarMalawiMaldivesMaliMaltaMarshall IslandsMauritaniaMauritiusMexicoMicronesia, Fed. Sts.Middle East & North AfricaMiddle East & North Africa (excluding high income)Middle East & North Africa (IDA & IBRD countries)Middle incomeMoldovaMongoliaMontenegroMoroccoMozambiqueMyanmarNamibiaNauruNepalNetherlandsNew ZealandNicaraguaNigerNigeriaNorth AmericaNorwayOECD membersOmanOther small statesPacific island small statesPakistanPalauPanamaPapua New GuineaParaguayPeruPhilippinesPolandPortugalPost-demographic dividendPre-demographic dividendPuerto RicoQatarRomaniaRussian FederationRwandaSamoaSan MarinoSao Tome and PrincipeSaudi ArabiaSenegalSerbiaSeychellesSierra LeoneSlovak RepublicSloveniaSmall statesSolomon IslandsSouth AfricaSouth AsiaSouth Asia (IDA & IBRD)South SudanSpainSri LankaSt. Kitts and NevisSt. LuciaSt. Vincent and the GrenadinesSub-Saharan Africa Sub-Saharan Africa (excluding high income)Sub-Saharan Africa (IDA & IBRD countries)SudanSurinameSwazilandSwedenSwitzerlandSyrian Arab RepublicTajikistanTanzaniaThailandTimor-LesteTogoTongaTrinidad and TobagoTunisiaTurkeyTuvaluUgandaUkraineUnited Arab EmiratesUnited StatesUpper middle incomeUruguayUzbekistanVanuatuVenezuela, RBVietnamWest Bank and GazaWorldYemen, Rep.ZambiaZimbabwe Timeline:
This timeline shows a graph from 1973 to 2015 of Brunei Darussalam. No data until 1972. Number of actual observations by date: 32.
Source name:
World Development Indicators
Source organization:
UNESCO Institute for Statistics
Categories, topics:
Education, Gender
Last updated:
apr 23, 2017
Indicators value changes by year
Minimum:
33.909
jan 1, 1980
Maximum:
113.905
jan 1, 2007
At the date of observation
Value
Absolute change
Change from previous value
jan 1, 1973
108.784
+108.784
0.0%
jan 1, 1974
109.799
+1.015
0.93%
jan 1, 1975
104.647
-5.152
-4.69%
jan 1, 1976
102.616
-2.03
-1.94%
jan 1, 1977
102.845
+0.229
0.22%
jan 1, 1978
108.326
+5.481
5.33%
jan 1, 1979
104.435
-3.891
-3.59%
jan 1, 1980
33.909
-70.526
-67.53%
jan 1, 1981
99.549
+65.64
193.58%
jan 1, 1982
100.796
+1.248
1.25%
jan 1, 1983
93.925
-6.871
-6.82%
jan 1, 1984
97.478
+3.552
3.78%
jan 1, 1985
99.569
+2.091
2.15%
jan 1, 1987
104.011
+4.442
4.46%
jan 1, 1998
105.507
+1.496
1.44%
jan 1, 1999
110.845
+5.338
5.06%
jan 1, 2000
108.773
-2.072
-1.87%
jan 1, 2001
107.635
-1.138
-1.05%
jan 1, 2002
103.84
-3.795
-3.53%
jan 1, 2003
105.221
+1.381
1.33%
jan 1, 2004
106.81
+1.589
1.51%
jan 1, 2005
105.958
-0.852
-0.8%
jan 1, 2006
107.411
+1.452
1.37%
jan 1, 2007
113.905
+6.494
6.05%
jan 1, 2008
108.392
-5.513
-4.84%
jan 1, 2009
109.135
+0.744
0.69%
jan 1, 2010
101.874
-7.261
-6.65%
jan 1, 2011
105.566
+3.692
3.62%
jan 1, 2012
108.015
+2.449
2.32%
jan 1, 2013
108.279
+0.264
0.24%
jan 1, 2014
110.482
+2.203
2.03%
jan 1, 2015
107.381
-3.102
-2.81%
Ranking of countries by current statistics by years


Comments: