29
/
en
AIzaSyAYiBZKx7MnpbEhh9jyipgxe19OcubqV5w
April 1, 2024
56268
Small states
SST
false
2
1
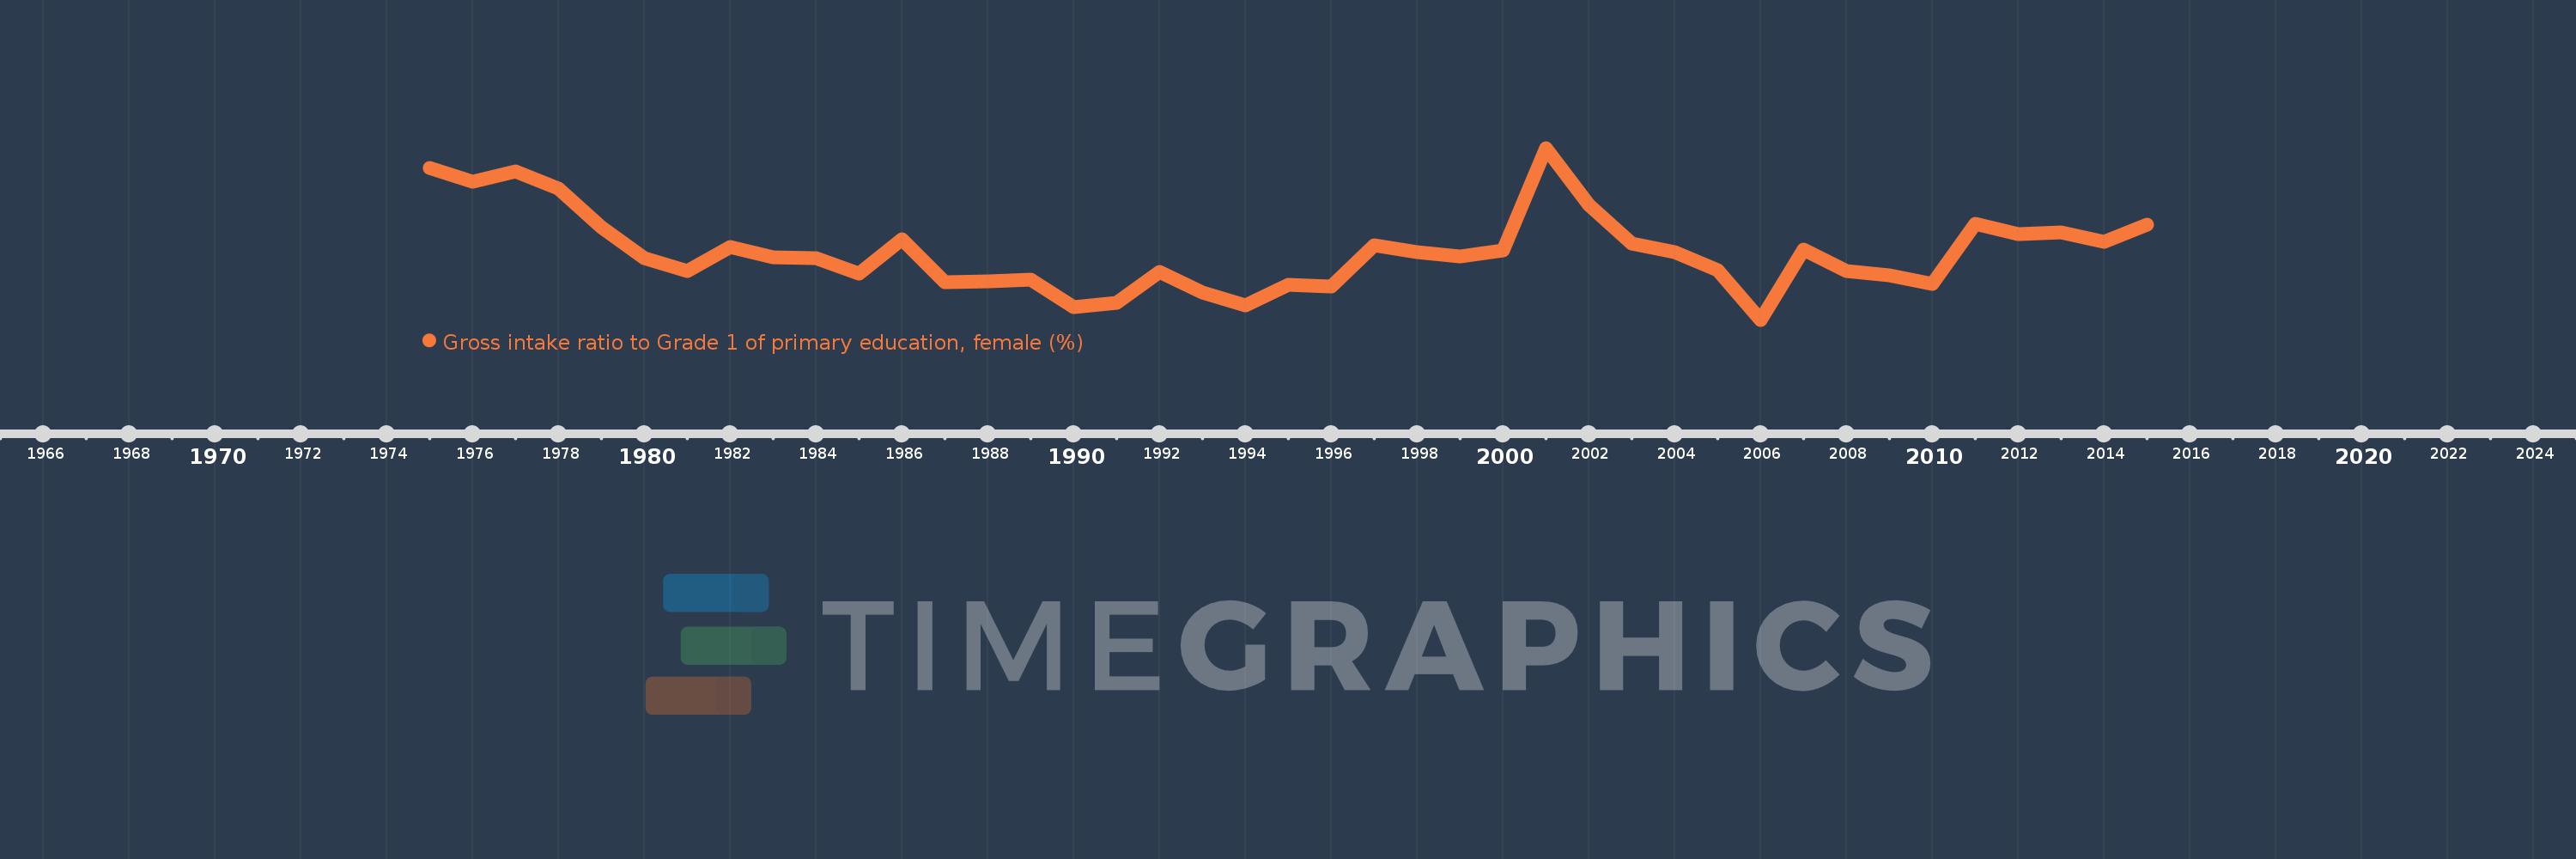
Gross intake ratio to Grade 1 of primary education, female (%)
2015,2014,2013,2012,2011,2010,2009,2008,2007,2006,2005,2004,2003,2002,2001,2000,1999,1998,1997,1996,1995,1994,1993,1992,1991,1990,1989,1988,1987,1986,1985,1984,1983,1982,1981,1980,1979,1978,1977,1976,1975
This statistics in other country:
AfghanistanAlbaniaAlgeriaAngolaAntigua and BarbudaArab WorldArgentinaArmeniaArubaAustriaAzerbaijanBahamas, TheBahrainBangladeshBarbadosBelarusBelgiumBelizeBeninBermudaBhutanBoliviaBosnia and HerzegovinaBotswanaBrazilBrunei DarussalamBulgariaBurkina FasoBurundiCabo VerdeCambodiaCameroonCanadaCaribbean small statesCentral African RepublicCentral Europe and the BalticsChadChileChinaColombiaComorosCongo, Dem. Rep.Congo, Rep.Costa RicaCote d'IvoireCroatiaCubaCyprusCzech RepublicDenmarkDjiboutiDominicaDominican RepublicEarly-demographic dividendEast Asia & PacificEast Asia & Pacific (excluding high income)East Asia & Pacific (IDA & IBRD countries)EcuadorEgypt, Arab Rep.El SalvadorEquatorial GuineaEritreaEstoniaEthiopiaEuro areaEurope & Central AsiaEurope & Central Asia (excluding high income)Europe & Central Asia (IDA & IBRD countries)European UnionFijiFinlandFragile and conflict affected situationsFranceGabonGambia, TheGeorgiaGermanyGhanaGreeceGrenadaGuatemalaGuineaGuinea-BissauGuyanaHaitiHeavily indebted poor countries (HIPC)High incomeHondurasHong Kong SAR, ChinaHungaryIBRD onlyIcelandIDA & IBRD totalIDA blendIDA onlyIDA totalIndiaIndonesiaIran, Islamic Rep.IraqIrelandIsraelItalyJamaicaJapanJordanKazakhstanKenyaKiribatiKorea, Dem. People’s Rep.Korea, Rep.KuwaitKyrgyz RepublicLao PDRLate-demographic dividendLatin America & Caribbean Latin America & Caribbean (excluding high income)Latin America & the Caribbean (IDA & IBRD countries)LatviaLeast developed countries: UN classificationLebanonLesothoLiberiaLibyaLiechtensteinLithuaniaLow & middle incomeLow incomeLower middle incomeLuxembourgMacao SAR, ChinaMacedonia, FYRMadagascarMalawiMaldivesMaliMaltaMarshall IslandsMauritaniaMauritiusMexicoMicronesia, Fed. Sts.Middle East & North AfricaMiddle East & North Africa (excluding high income)Middle East & North Africa (IDA & IBRD countries)Middle incomeMoldovaMongoliaMontenegroMoroccoMozambiqueMyanmarNamibiaNauruNepalNetherlandsNew ZealandNicaraguaNigerNigeriaNorth AmericaNorwayOECD membersOmanOther small statesPacific island small statesPakistanPalauPanamaPapua New GuineaParaguayPeruPhilippinesPolandPortugalPost-demographic dividendPre-demographic dividendPuerto RicoQatarRomaniaRussian FederationRwandaSamoaSan MarinoSao Tome and PrincipeSaudi ArabiaSenegalSerbiaSeychellesSierra LeoneSlovak RepublicSloveniaSmall statesSolomon IslandsSouth AfricaSouth AsiaSouth Asia (IDA & IBRD)South SudanSpainSri LankaSt. Kitts and NevisSt. LuciaSt. Vincent and the GrenadinesSub-Saharan Africa Sub-Saharan Africa (excluding high income)Sub-Saharan Africa (IDA & IBRD countries)SudanSurinameSwazilandSwedenSwitzerlandSyrian Arab RepublicTajikistanTanzaniaThailandTimor-LesteTogoTongaTrinidad and TobagoTunisiaTurkeyTuvaluUgandaUkraineUnited Arab EmiratesUnited StatesUpper middle incomeUruguayUzbekistanVanuatuVenezuela, RBVietnamWest Bank and GazaWorldYemen, Rep.ZambiaZimbabwe Timeline:
This timeline shows a graph from 1975 to 2015 of Small states. No data until 1974. Number of actual observations by date: 41.
Source name:
World Development Indicators
Source organization:
UNESCO Institute for Statistics
Categories, topics:
Education, Gender
Last updated:
apr 23, 2017
Indicators value changes by year
Minimum:
99.107
jan 1, 2006
Maximum:
108.948
jan 1, 2001
At the date of observation
Value
Absolute change
Change from previous value
jan 1, 1975
107.804
+107.804
0.0%
jan 1, 1976
107.012
-0.792
-0.73%
jan 1, 1977
107.594
+0.582
0.54%
jan 1, 1978
106.6
-0.994
-0.92%
jan 1, 1979
104.415
-2.185
-2.05%
jan 1, 1980
102.658
-1.757
-1.68%
jan 1, 1981
101.912
-0.746
-0.73%
jan 1, 1982
103.298
+1.386
1.36%
jan 1, 1983
102.699
-0.599
-0.58%
jan 1, 1984
102.633
-0.066
-0.06%
jan 1, 1985
101.766
-0.867
-0.84%
jan 1, 1986
103.706
+1.94
1.91%
jan 1, 1987
101.244
-2.461
-2.37%
jan 1, 1988
101.29
+0.045
0.04%
jan 1, 1989
101.385
+0.095
0.09%
jan 1, 1990
99.838
-1.547
-1.53%
jan 1, 1991
100.087
+0.25
0.25%
jan 1, 1992
101.838
+1.751
1.75%
jan 1, 1993
100.683
-1.155
-1.13%
jan 1, 1994
99.908
-0.775
-0.77%
jan 1, 1995
101.128
+1.22
1.22%
jan 1, 1996
101.022
-0.106
-0.1%
jan 1, 1997
103.35
+2.328
2.3%
jan 1, 1998
102.961
-0.39
-0.38%
jan 1, 1999
102.758
-0.203
-0.2%
jan 1, 2000
103.086
+0.328
0.32%
jan 1, 2001
108.948
+5.862
5.69%
jan 1, 2002
105.702
-3.247
-2.98%
jan 1, 2003
103.465
-2.237
-2.12%
jan 1, 2004
102.968
-0.497
-0.48%
jan 1, 2005
101.943
-1.025
-1.0%
jan 1, 2006
99.107
-2.836
-2.78%
jan 1, 2007
103.15
+4.042
4.08%
jan 1, 2008
101.884
-1.265
-1.23%
jan 1, 2009
101.629
-0.255
-0.25%
jan 1, 2010
101.174
-0.456
-0.45%
jan 1, 2011
104.593
+3.42
3.38%
jan 1, 2012
104.001
-0.592
-0.57%
jan 1, 2013
104.096
+0.095
0.09%
jan 1, 2014
103.588
-0.507
-0.49%
jan 1, 2015
104.572
+0.984
0.95%
Ranking of countries by current statistics by years


Comments: