29
/
en
AIzaSyAYiBZKx7MnpbEhh9jyipgxe19OcubqV5w
April 1, 2024
164907
Jordan
JOR
true
2
1
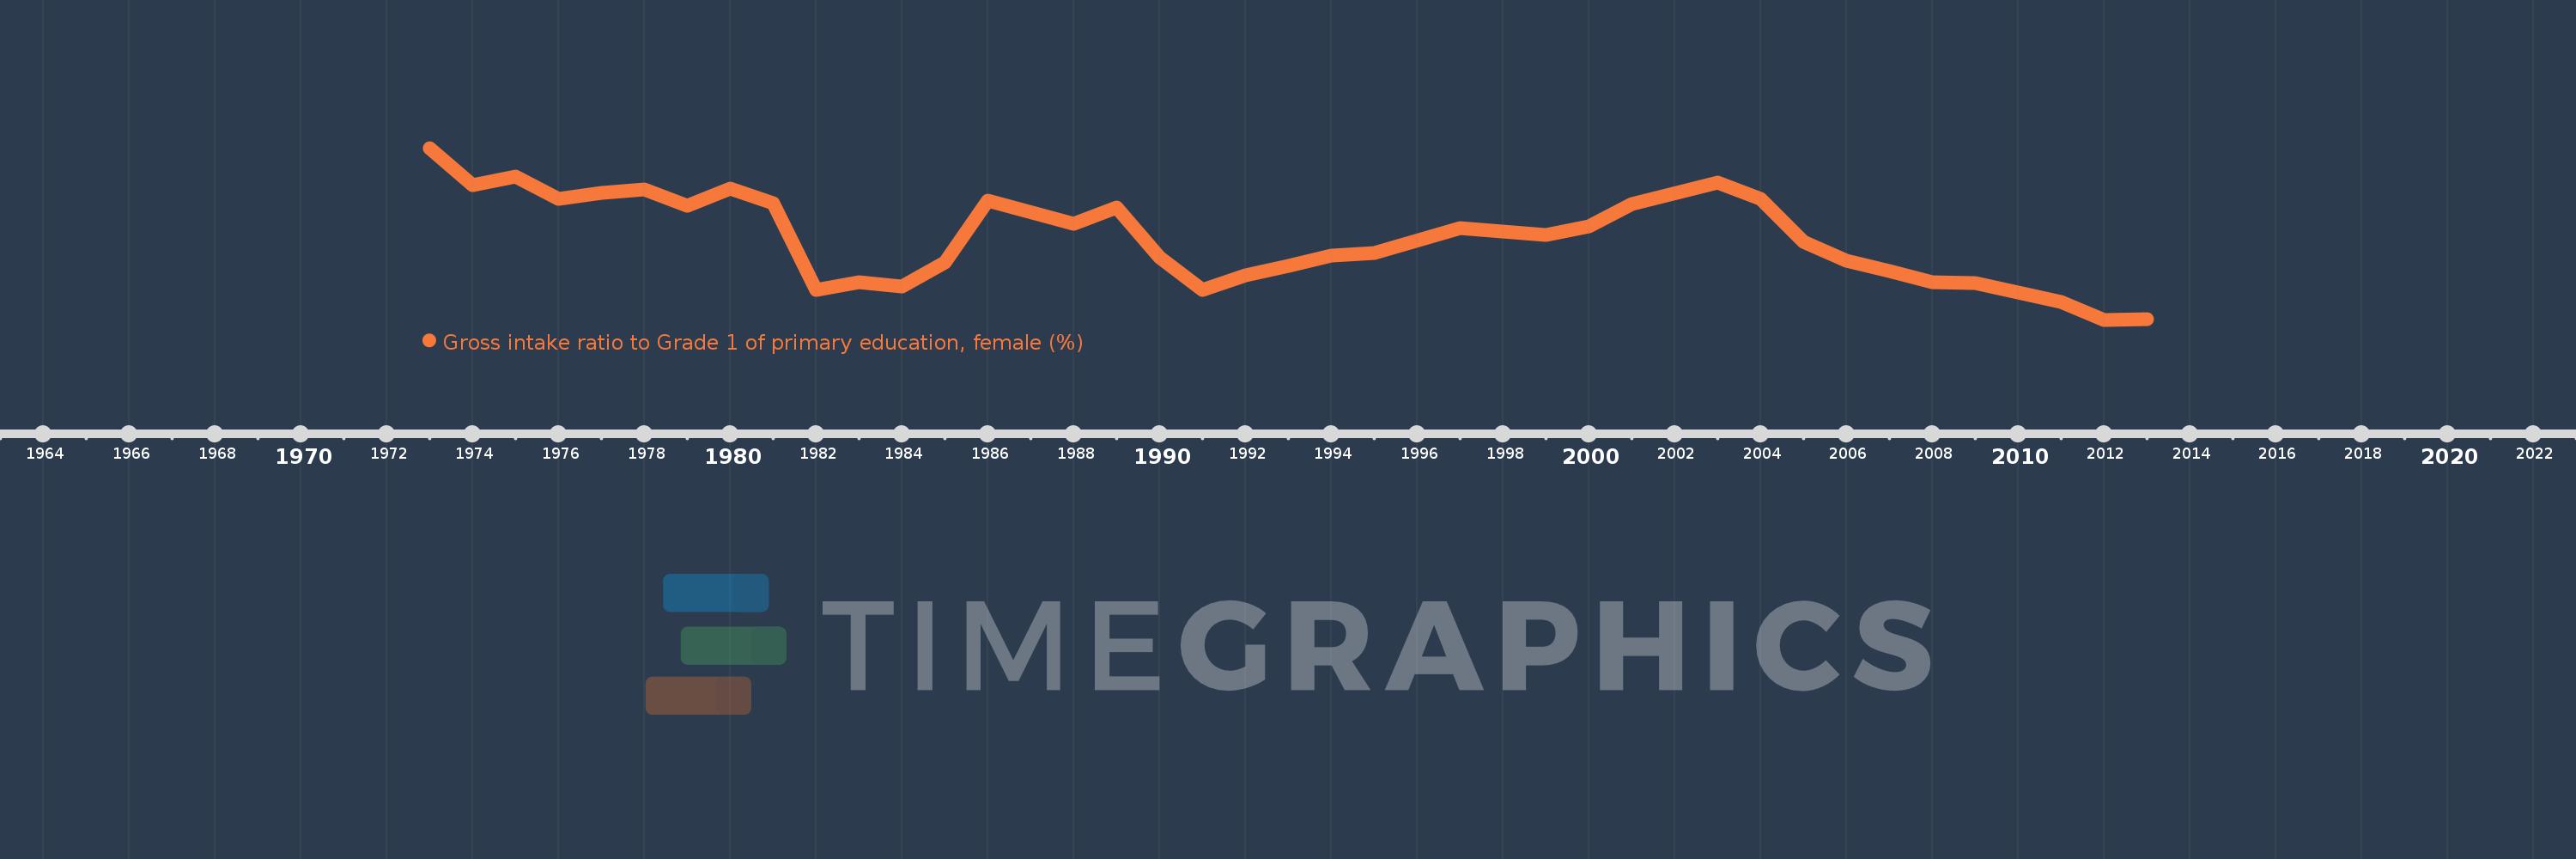
Gross intake ratio to Grade 1 of primary education, female (%)
2013,2012,2011,2009,2008,2007,2006,2005,2004,2003,2001,2000,1999,1997,1995,1994,1993,1992,1991,1990,1989,1988,1986,1985,1984,1983,1982,1981,1980,1979,1978,1977,1976,1975,1974,1973
This statistics in other country:
AfghanistanAlbaniaAlgeriaAngolaAntigua and BarbudaArab WorldArgentinaArmeniaArubaAustriaAzerbaijanBahamas, TheBahrainBangladeshBarbadosBelarusBelgiumBelizeBeninBermudaBhutanBoliviaBosnia and HerzegovinaBotswanaBrazilBrunei DarussalamBulgariaBurkina FasoBurundiCabo VerdeCambodiaCameroonCanadaCaribbean small statesCentral African RepublicCentral Europe and the BalticsChadChileChinaColombiaComorosCongo, Dem. Rep.Congo, Rep.Costa RicaCote d'IvoireCroatiaCubaCyprusCzech RepublicDenmarkDjiboutiDominicaDominican RepublicEarly-demographic dividendEast Asia & PacificEast Asia & Pacific (excluding high income)East Asia & Pacific (IDA & IBRD countries)EcuadorEgypt, Arab Rep.El SalvadorEquatorial GuineaEritreaEstoniaEthiopiaEuro areaEurope & Central AsiaEurope & Central Asia (excluding high income)Europe & Central Asia (IDA & IBRD countries)European UnionFijiFinlandFragile and conflict affected situationsFranceGabonGambia, TheGeorgiaGermanyGhanaGreeceGrenadaGuatemalaGuineaGuinea-BissauGuyanaHaitiHeavily indebted poor countries (HIPC)High incomeHondurasHong Kong SAR, ChinaHungaryIBRD onlyIcelandIDA & IBRD totalIDA blendIDA onlyIDA totalIndiaIndonesiaIran, Islamic Rep.IraqIrelandIsraelItalyJamaicaJapanJordanKazakhstanKenyaKiribatiKorea, Dem. People’s Rep.Korea, Rep.KuwaitKyrgyz RepublicLao PDRLate-demographic dividendLatin America & Caribbean Latin America & Caribbean (excluding high income)Latin America & the Caribbean (IDA & IBRD countries)LatviaLeast developed countries: UN classificationLebanonLesothoLiberiaLibyaLiechtensteinLithuaniaLow & middle incomeLow incomeLower middle incomeLuxembourgMacao SAR, ChinaMacedonia, FYRMadagascarMalawiMaldivesMaliMaltaMarshall IslandsMauritaniaMauritiusMexicoMicronesia, Fed. Sts.Middle East & North AfricaMiddle East & North Africa (excluding high income)Middle East & North Africa (IDA & IBRD countries)Middle incomeMoldovaMongoliaMontenegroMoroccoMozambiqueMyanmarNamibiaNauruNepalNetherlandsNew ZealandNicaraguaNigerNigeriaNorth AmericaNorwayOECD membersOmanOther small statesPacific island small statesPakistanPalauPanamaPapua New GuineaParaguayPeruPhilippinesPolandPortugalPost-demographic dividendPre-demographic dividendPuerto RicoQatarRomaniaRussian FederationRwandaSamoaSan MarinoSao Tome and PrincipeSaudi ArabiaSenegalSerbiaSeychellesSierra LeoneSlovak RepublicSloveniaSmall statesSolomon IslandsSouth AfricaSouth AsiaSouth Asia (IDA & IBRD)South SudanSpainSri LankaSt. Kitts and NevisSt. LuciaSt. Vincent and the GrenadinesSub-Saharan Africa Sub-Saharan Africa (excluding high income)Sub-Saharan Africa (IDA & IBRD countries)SudanSurinameSwazilandSwedenSwitzerlandSyrian Arab RepublicTajikistanTanzaniaThailandTimor-LesteTogoTongaTrinidad and TobagoTunisiaTurkeyTuvaluUgandaUkraineUnited Arab EmiratesUnited StatesUpper middle incomeUruguayUzbekistanVanuatuVenezuela, RBVietnamWest Bank and GazaWorldYemen, Rep.ZambiaZimbabwe Timeline:
This timeline shows a graph from 1973 to 2013 of Jordan. No data until 1972. Number of actual observations by date: 36.
Source name:
World Development Indicators
Source organization:
UNESCO Institute for Statistics
Categories, topics:
Education, Gender
Last updated:
apr 23, 2017
Indicators value changes by year
Minimum:
90.675
jan 1, 2012
Maximum:
115.309
jan 1, 1973
At the date of observation
Value
Absolute change
Change from previous value
jan 1, 1973
115.309
+115.309
0.0%
jan 1, 1974
109.965
-5.344
-4.63%
jan 1, 1975
111.163
+1.198
1.09%
jan 1, 1976
108.054
-3.109
-2.8%
jan 1, 1977
108.807
+0.753
0.7%
jan 1, 1978
109.362
+0.555
0.51%
jan 1, 1979
107.07
-2.292
-2.1%
jan 1, 1980
109.466
+2.396
2.24%
jan 1, 1981
107.336
-2.131
-1.95%
jan 1, 1982
94.994
-12.341
-11.5%
jan 1, 1983
96.082
+1.088
1.15%
jan 1, 1984
95.406
-0.676
-0.7%
jan 1, 1985
98.848
+3.442
3.61%
jan 1, 1986
107.76
+8.912
9.02%
jan 1, 1988
104.385
-3.375
-3.13%
jan 1, 1989
106.77
+2.385
2.28%
jan 1, 1990
99.576
-7.193
-6.74%
jan 1, 1991
94.962
-4.614
-4.63%
jan 1, 1992
97.097
+2.134
2.25%
jan 1, 1993
98.416
+1.319
1.36%
jan 1, 1994
99.912
+1.497
1.52%
jan 1, 1995
100.274
+0.362
0.36%
jan 1, 1997
103.831
+3.556
3.55%
jan 1, 1999
102.855
-0.976
-0.94%
jan 1, 2000
104.083
+1.228
1.19%
jan 1, 2001
107.311
+3.228
3.1%
jan 1, 2003
110.378
+3.067
2.86%
jan 1, 2004
107.991
-2.387
-2.16%
jan 1, 2005
101.832
-6.159
-5.7%
jan 1, 2006
99.144
-2.688
-2.64%
jan 1, 2007
97.686
-1.458
-1.47%
jan 1, 2008
96.078
-1.608
-1.65%
jan 1, 2009
95.88
-0.198
-0.21%
jan 1, 2011
93.248
-2.631
-2.74%
jan 1, 2012
90.675
-2.574
-2.76%
jan 1, 2013
90.701
+0.026
0.03%
Ranking of countries by current statistics by years


Comments: