29
/
en
AIzaSyAYiBZKx7MnpbEhh9jyipgxe19OcubqV5w
April 1, 2024
210436
Nicaragua
NIC
true
2
1
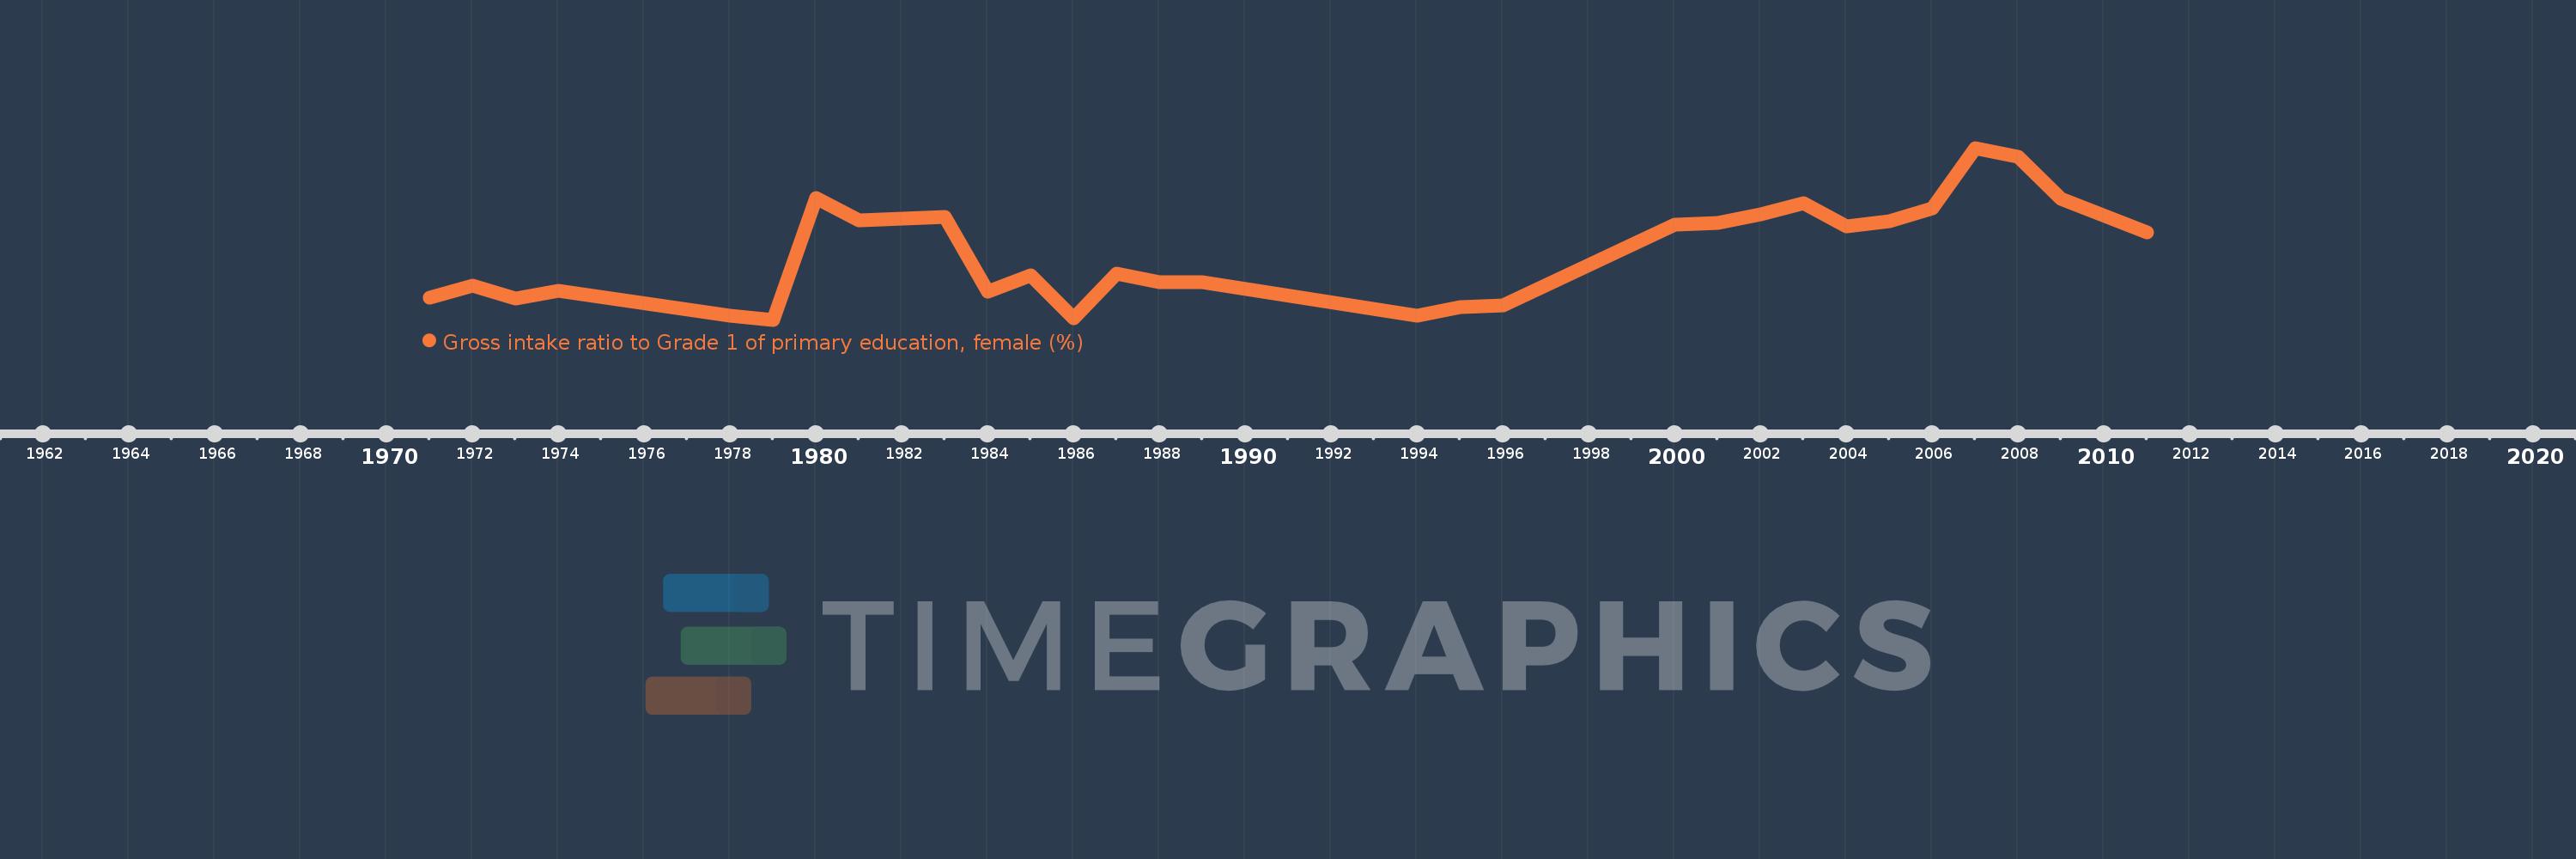
Gross intake ratio to Grade 1 of primary education, female (%)
2011,2009,2008,2007,2006,2005,2004,2003,2002,2001,2000,1996,1995,1994,1989,1988,1987,1986,1985,1984,1983,1981,1980,1979,1978,1974,1973,1972,1971
This statistics in other country:
AfghanistanAlbaniaAlgeriaAngolaAntigua and BarbudaArab WorldArgentinaArmeniaArubaAustriaAzerbaijanBahamas, TheBahrainBangladeshBarbadosBelarusBelgiumBelizeBeninBermudaBhutanBoliviaBosnia and HerzegovinaBotswanaBrazilBrunei DarussalamBulgariaBurkina FasoBurundiCabo VerdeCambodiaCameroonCanadaCaribbean small statesCentral African RepublicCentral Europe and the BalticsChadChileChinaColombiaComorosCongo, Dem. Rep.Congo, Rep.Costa RicaCote d'IvoireCroatiaCubaCyprusCzech RepublicDenmarkDjiboutiDominicaDominican RepublicEarly-demographic dividendEast Asia & PacificEast Asia & Pacific (excluding high income)East Asia & Pacific (IDA & IBRD countries)EcuadorEgypt, Arab Rep.El SalvadorEquatorial GuineaEritreaEstoniaEthiopiaEuro areaEurope & Central AsiaEurope & Central Asia (excluding high income)Europe & Central Asia (IDA & IBRD countries)European UnionFijiFinlandFragile and conflict affected situationsFranceGabonGambia, TheGeorgiaGermanyGhanaGreeceGrenadaGuatemalaGuineaGuinea-BissauGuyanaHaitiHeavily indebted poor countries (HIPC)High incomeHondurasHong Kong SAR, ChinaHungaryIBRD onlyIcelandIDA & IBRD totalIDA blendIDA onlyIDA totalIndiaIndonesiaIran, Islamic Rep.IraqIrelandIsraelItalyJamaicaJapanJordanKazakhstanKenyaKiribatiKorea, Dem. People’s Rep.Korea, Rep.KuwaitKyrgyz RepublicLao PDRLate-demographic dividendLatin America & Caribbean Latin America & Caribbean (excluding high income)Latin America & the Caribbean (IDA & IBRD countries)LatviaLeast developed countries: UN classificationLebanonLesothoLiberiaLibyaLiechtensteinLithuaniaLow & middle incomeLow incomeLower middle incomeLuxembourgMacao SAR, ChinaMacedonia, FYRMadagascarMalawiMaldivesMaliMaltaMarshall IslandsMauritaniaMauritiusMexicoMicronesia, Fed. Sts.Middle East & North AfricaMiddle East & North Africa (excluding high income)Middle East & North Africa (IDA & IBRD countries)Middle incomeMoldovaMongoliaMontenegroMoroccoMozambiqueMyanmarNamibiaNauruNepalNetherlandsNew ZealandNicaraguaNigerNigeriaNorth AmericaNorwayOECD membersOmanOther small statesPacific island small statesPakistanPalauPanamaPapua New GuineaParaguayPeruPhilippinesPolandPortugalPost-demographic dividendPre-demographic dividendPuerto RicoQatarRomaniaRussian FederationRwandaSamoaSan MarinoSao Tome and PrincipeSaudi ArabiaSenegalSerbiaSeychellesSierra LeoneSlovak RepublicSloveniaSmall statesSolomon IslandsSouth AfricaSouth AsiaSouth Asia (IDA & IBRD)South SudanSpainSri LankaSt. Kitts and NevisSt. LuciaSt. Vincent and the GrenadinesSub-Saharan Africa Sub-Saharan Africa (excluding high income)Sub-Saharan Africa (IDA & IBRD countries)SudanSurinameSwazilandSwedenSwitzerlandSyrian Arab RepublicTajikistanTanzaniaThailandTimor-LesteTogoTongaTrinidad and TobagoTunisiaTurkeyTuvaluUgandaUkraineUnited Arab EmiratesUnited StatesUpper middle incomeUruguayUzbekistanVanuatuVenezuela, RBVietnamWest Bank and GazaWorldYemen, Rep.ZambiaZimbabwe Timeline:
This timeline shows a graph from 1971 to 2011 of Nicaragua. No data until 1970. Number of actual observations by date: 29.
Source name:
World Development Indicators
Source organization:
UNESCO Institute for Statistics
Categories, topics:
Education, Gender
Last updated:
apr 23, 2017
Indicators value changes by year
Minimum:
116.344
jan 1, 1979
Maximum:
172.571
jan 1, 2007
At the date of observation
Value
Absolute change
Change from previous value
jan 1, 1971
123.592
+123.592
0.0%
jan 1, 1972
127.383
+3.791
3.07%
jan 1, 1973
123.428
-3.954
-3.1%
jan 1, 1974
125.765
+2.336
1.89%
jan 1, 1978
117.591
-8.174
-6.5%
jan 1, 1979
116.344
-1.247
-1.06%
jan 1, 1980
156.305
+39.961
34.35%
jan 1, 1981
148.977
-7.328
-4.69%
jan 1, 1983
150.112
+1.136
0.76%
jan 1, 1984
125.417
-24.695
-16.45%
jan 1, 1985
131.008
+5.591
4.46%
jan 1, 1986
116.875
-14.133
-10.79%
jan 1, 1987
131.346
+14.471
12.38%
jan 1, 1988
128.633
-2.713
-2.07%
jan 1, 1989
128.693
+0.06
0.05%
jan 1, 1994
117.639
-11.054
-8.59%
jan 1, 1995
120.605
+2.966
2.52%
jan 1, 1996
120.913
+0.307
0.25%
jan 1, 2000
147.431
+26.518
21.93%
jan 1, 2001
148.109
+0.678
0.46%
jan 1, 2002
150.777
+2.668
1.8%
jan 1, 2003
154.367
+3.59
2.38%
jan 1, 2004
146.772
-7.594
-4.92%
jan 1, 2005
148.679
+1.907
1.3%
jan 1, 2006
152.887
+4.208
2.83%
jan 1, 2007
172.571
+19.684
12.87%
jan 1, 2008
169.783
-2.788
-1.62%
jan 1, 2009
155.871
-13.913
-8.19%
jan 1, 2011
144.971
-10.899
-6.99%
Ranking of countries by current statistics by years


Comments: