29
/
en
AIzaSyAYiBZKx7MnpbEhh9jyipgxe19OcubqV5w
April 1, 2024
264669
Togo
TGO
true
2
1
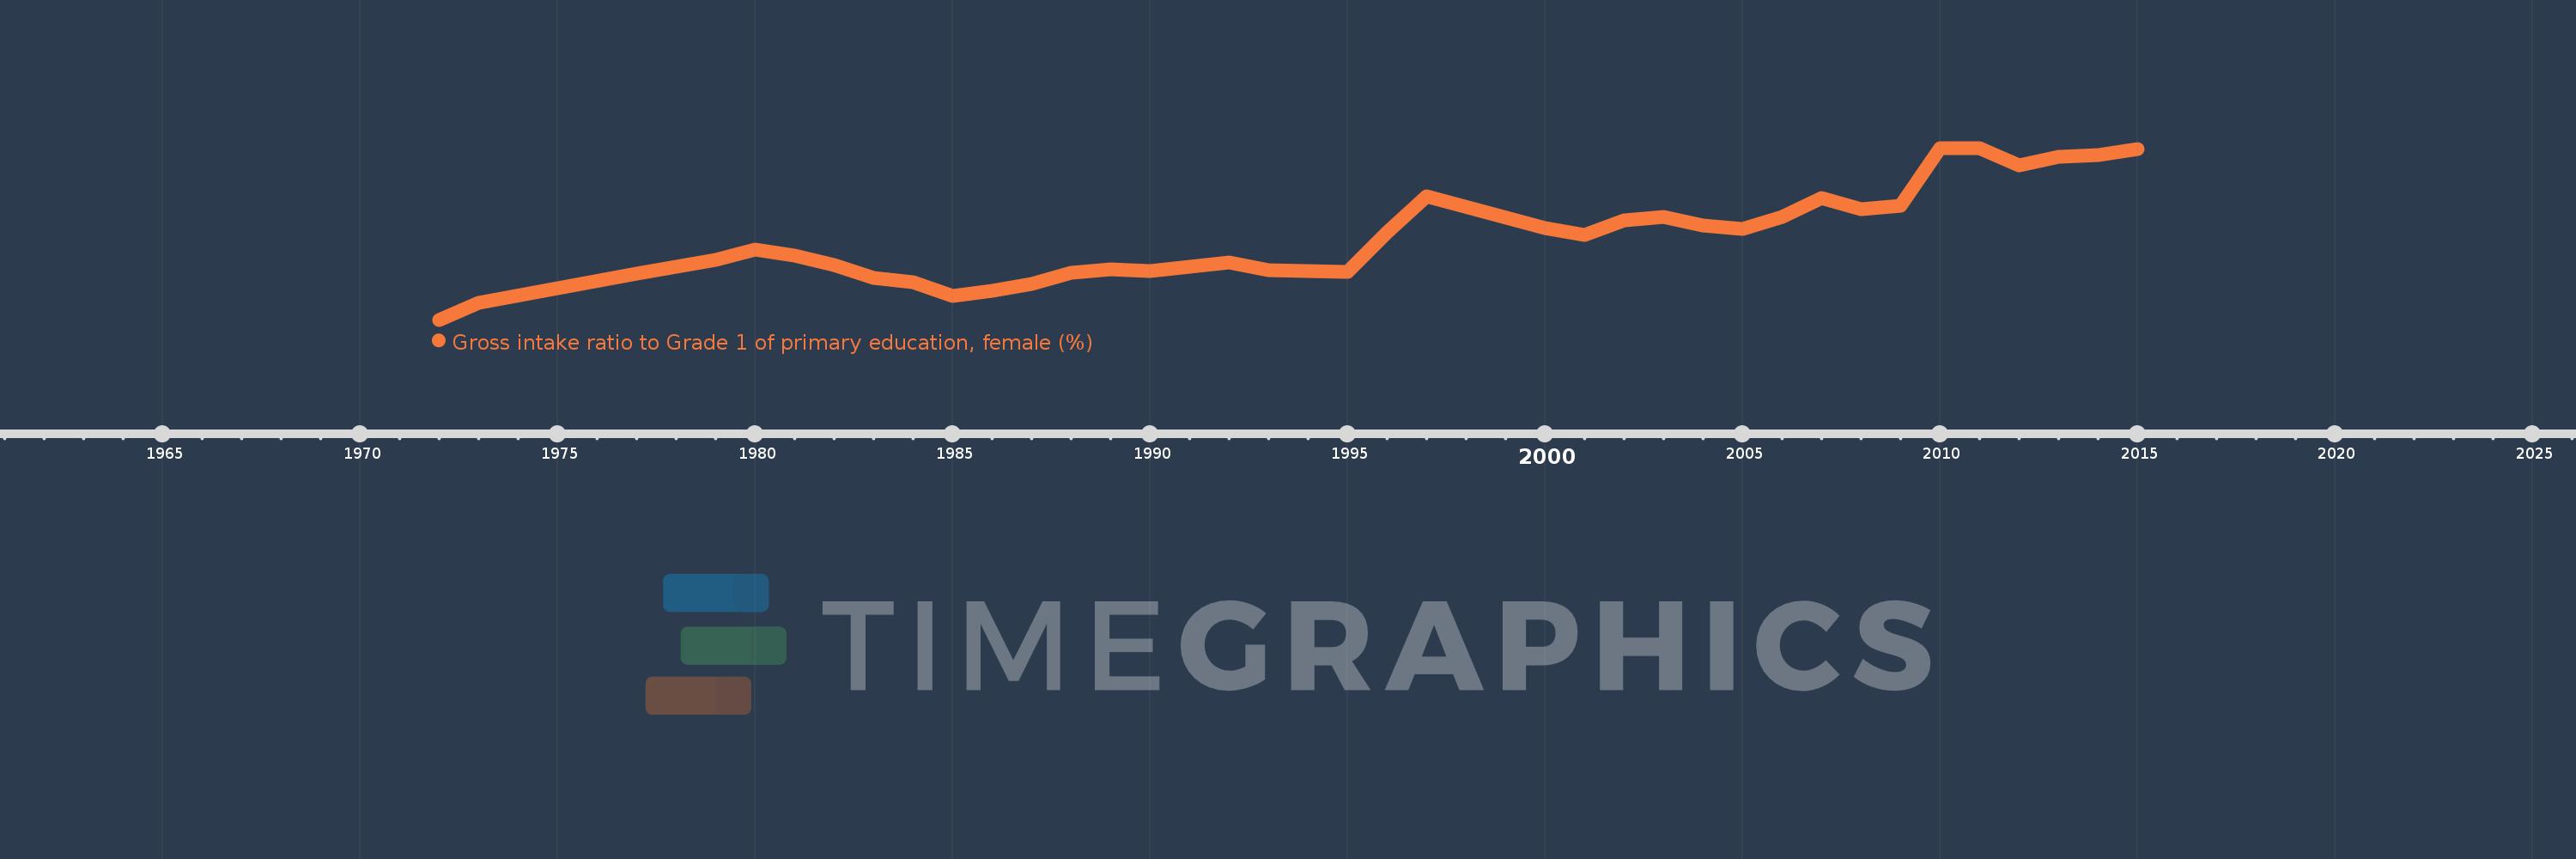
Gross intake ratio to Grade 1 of primary education, female (%)
2015,2014,2013,2012,2011,2010,2009,2008,2007,2006,2005,2004,2003,2002,2001,2000,1997,1996,1995,1993,1992,1991,1990,1989,1988,1987,1986,1985,1984,1983,1982,1981,1980,1979,1977,1973,1972
This statistics in other country:
AfghanistanAlbaniaAlgeriaAngolaAntigua and BarbudaArab WorldArgentinaArmeniaArubaAustriaAzerbaijanBahamas, TheBahrainBangladeshBarbadosBelarusBelgiumBelizeBeninBermudaBhutanBoliviaBosnia and HerzegovinaBotswanaBrazilBrunei DarussalamBulgariaBurkina FasoBurundiCabo VerdeCambodiaCameroonCanadaCaribbean small statesCentral African RepublicCentral Europe and the BalticsChadChileChinaColombiaComorosCongo, Dem. Rep.Congo, Rep.Costa RicaCote d'IvoireCroatiaCubaCyprusCzech RepublicDenmarkDjiboutiDominicaDominican RepublicEarly-demographic dividendEast Asia & PacificEast Asia & Pacific (excluding high income)East Asia & Pacific (IDA & IBRD countries)EcuadorEgypt, Arab Rep.El SalvadorEquatorial GuineaEritreaEstoniaEthiopiaEuro areaEurope & Central AsiaEurope & Central Asia (excluding high income)Europe & Central Asia (IDA & IBRD countries)European UnionFijiFinlandFragile and conflict affected situationsFranceGabonGambia, TheGeorgiaGermanyGhanaGreeceGrenadaGuatemalaGuineaGuinea-BissauGuyanaHaitiHeavily indebted poor countries (HIPC)High incomeHondurasHong Kong SAR, ChinaHungaryIBRD onlyIcelandIDA & IBRD totalIDA blendIDA onlyIDA totalIndiaIndonesiaIran, Islamic Rep.IraqIrelandIsraelItalyJamaicaJapanJordanKazakhstanKenyaKiribatiKorea, Dem. People’s Rep.Korea, Rep.KuwaitKyrgyz RepublicLao PDRLate-demographic dividendLatin America & Caribbean Latin America & Caribbean (excluding high income)Latin America & the Caribbean (IDA & IBRD countries)LatviaLeast developed countries: UN classificationLebanonLesothoLiberiaLibyaLiechtensteinLithuaniaLow & middle incomeLow incomeLower middle incomeLuxembourgMacao SAR, ChinaMacedonia, FYRMadagascarMalawiMaldivesMaliMaltaMarshall IslandsMauritaniaMauritiusMexicoMicronesia, Fed. Sts.Middle East & North AfricaMiddle East & North Africa (excluding high income)Middle East & North Africa (IDA & IBRD countries)Middle incomeMoldovaMongoliaMontenegroMoroccoMozambiqueMyanmarNamibiaNauruNepalNetherlandsNew ZealandNicaraguaNigerNigeriaNorth AmericaNorwayOECD membersOmanOther small statesPacific island small statesPakistanPalauPanamaPapua New GuineaParaguayPeruPhilippinesPolandPortugalPost-demographic dividendPre-demographic dividendPuerto RicoQatarRomaniaRussian FederationRwandaSamoaSan MarinoSao Tome and PrincipeSaudi ArabiaSenegalSerbiaSeychellesSierra LeoneSlovak RepublicSloveniaSmall statesSolomon IslandsSouth AfricaSouth AsiaSouth Asia (IDA & IBRD)South SudanSpainSri LankaSt. Kitts and NevisSt. LuciaSt. Vincent and the GrenadinesSub-Saharan Africa Sub-Saharan Africa (excluding high income)Sub-Saharan Africa (IDA & IBRD countries)SudanSurinameSwazilandSwedenSwitzerlandSyrian Arab RepublicTajikistanTanzaniaThailandTimor-LesteTogoTongaTrinidad and TobagoTunisiaTurkeyTuvaluUgandaUkraineUnited Arab EmiratesUnited StatesUpper middle incomeUruguayUzbekistanVanuatuVenezuela, RBVietnamWest Bank and GazaWorldYemen, Rep.ZambiaZimbabwe Timeline:
This timeline shows a graph from 1972 to 2015 of Togo. No data until 1971. Number of actual observations by date: 37.
Source name:
World Development Indicators
Source organization:
UNESCO Institute for Statistics
Categories, topics:
Education, Gender
Last updated:
apr 23, 2017
Indicators value changes by year
Minimum:
47.295
jan 1, 1972
Maximum:
132.692
jan 1, 2010
At the date of observation
Value
Absolute change
Change from previous value
jan 1, 1972
47.295
+47.295
0.0%
jan 1, 1973
55.848
+8.553
18.08%
jan 1, 1977
70.332
+14.485
25.94%
jan 1, 1979
77.046
+6.714
9.55%
jan 1, 1980
82.286
+5.24
6.8%
jan 1, 1981
79.32
-2.965
-3.6%
jan 1, 1982
74.388
-4.933
-6.22%
jan 1, 1983
68.013
-6.375
-8.57%
jan 1, 1984
66.086
-1.927
-2.83%
jan 1, 1985
59.218
-6.868
-10.39%
jan 1, 1986
61.474
+2.256
3.81%
jan 1, 1987
64.953
+3.479
5.66%
jan 1, 1988
70.467
+5.515
8.49%
jan 1, 1989
72.255
+1.787
2.54%
jan 1, 1990
71.679
-0.576
-0.8%
jan 1, 1991
73.63
+1.951
2.72%
jan 1, 1992
75.593
+1.963
2.67%
jan 1, 1993
71.735
-3.858
-5.1%
jan 1, 1995
71.059
-0.676
-0.94%
jan 1, 1996
90.636
+19.577
27.55%
jan 1, 1997
108.743
+18.107
19.98%
jan 1, 2000
92.933
-15.809
-14.54%
jan 1, 2001
89.416
-3.517
-3.78%
jan 1, 2002
96.897
+7.481
8.37%
jan 1, 2003
98.441
+1.544
1.59%
jan 1, 2004
94.015
-4.426
-4.5%
jan 1, 2005
92.496
-1.519
-1.62%
jan 1, 2006
98.459
+5.963
6.45%
jan 1, 2007
107.707
+9.248
9.39%
jan 1, 2008
102.149
-5.558
-5.16%
jan 1, 2009
103.823
+1.674
1.64%
jan 1, 2010
132.692
+28.868
27.81%
jan 1, 2011
132.647
-0.045
-0.03%
jan 1, 2012
123.953
-8.694
-6.55%
jan 1, 2013
128.391
+4.438
3.58%
jan 1, 2014
129.04
+0.65
0.51%
jan 1, 2015
132.085
+3.044
2.36%
Ranking of countries by current statistics by years


Comments: