29
/
en
AIzaSyAYiBZKx7MnpbEhh9jyipgxe19OcubqV5w
April 1, 2024
50954
Middle income
MIC
false
2
1
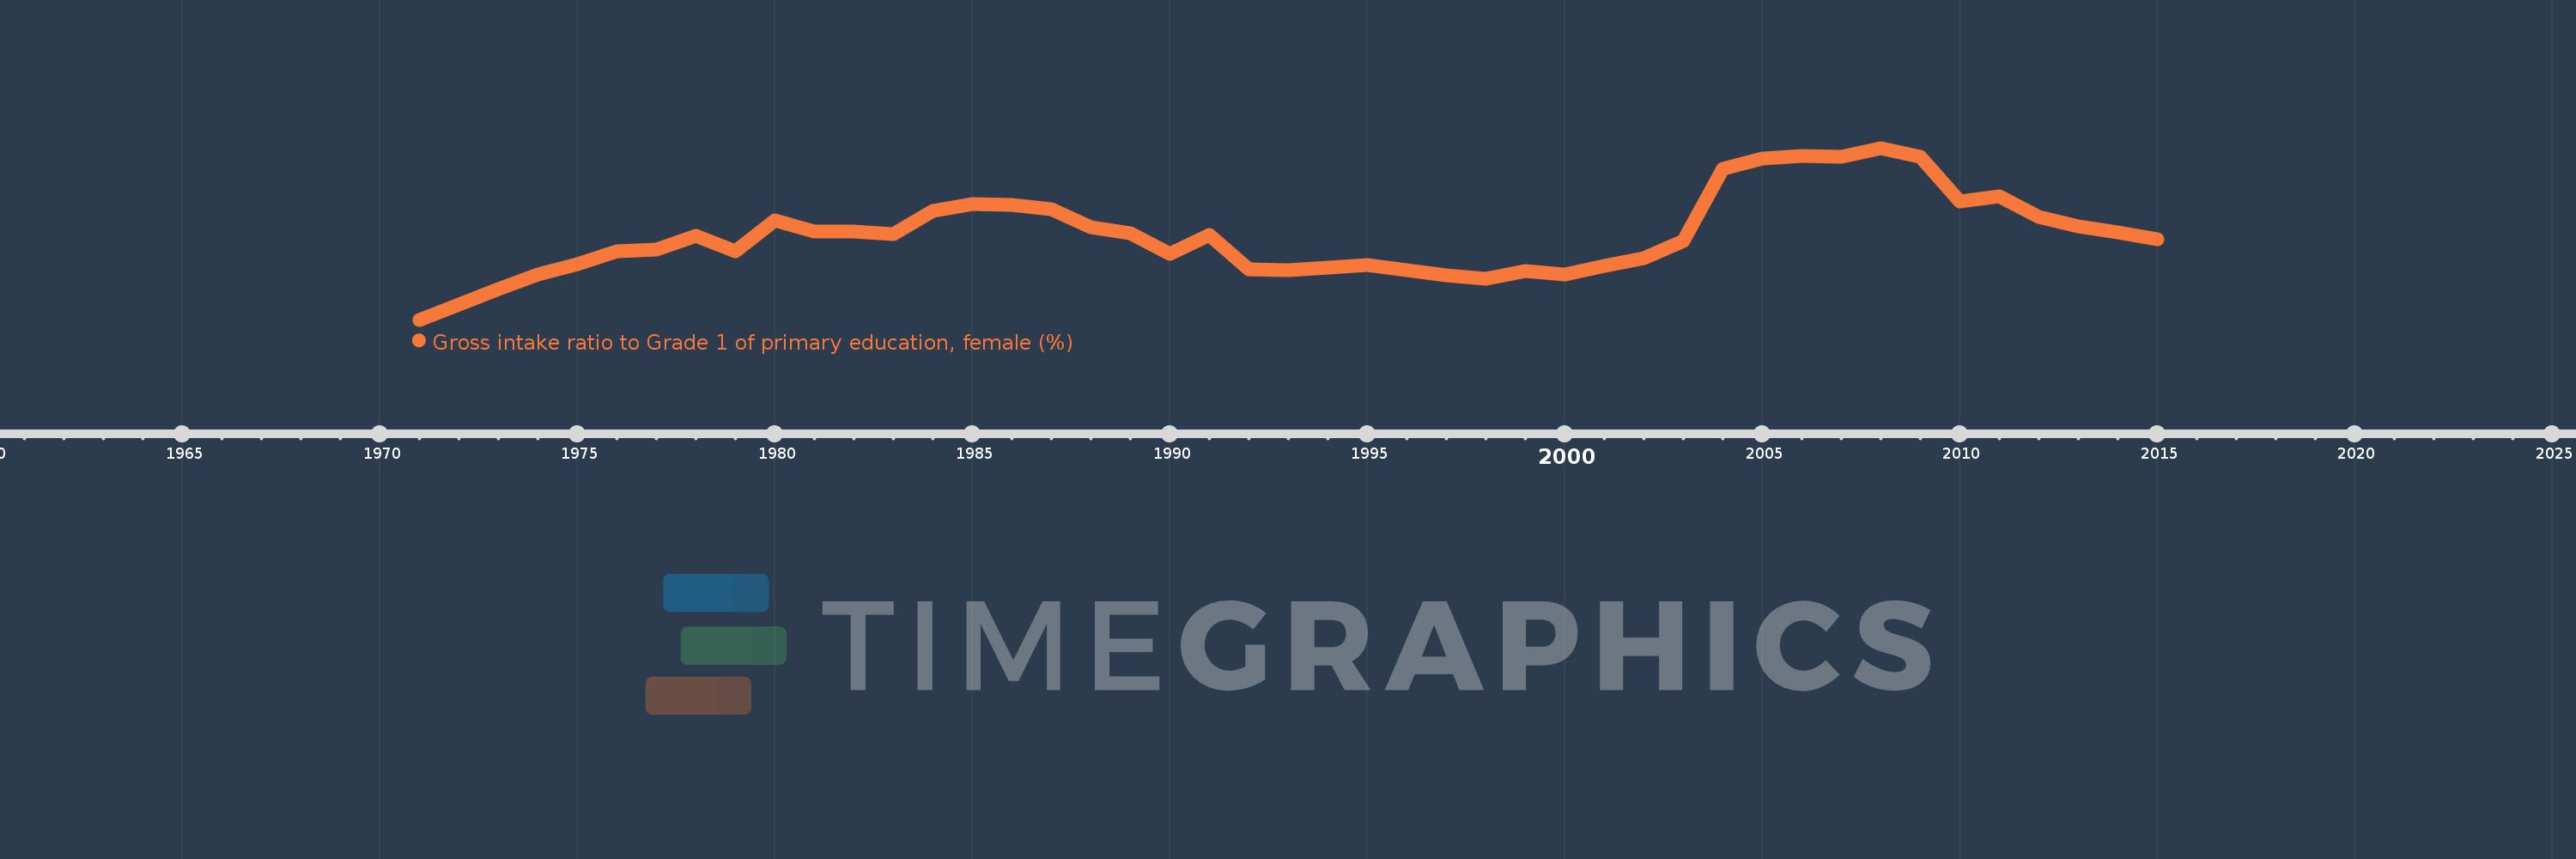
Gross intake ratio to Grade 1 of primary education, female (%)
2015,2014,2013,2012,2011,2010,2009,2008,2007,2006,2005,2004,2003,2002,2001,2000,1999,1998,1997,1996,1995,1994,1993,1992,1991,1990,1989,1988,1987,1986,1985,1984,1983,1982,1981,1980,1979,1978,1977,1976,1975,1974,1973,1972,1971
This statistics in other country:
AfghanistanAlbaniaAlgeriaAngolaAntigua and BarbudaArab WorldArgentinaArmeniaArubaAustriaAzerbaijanBahamas, TheBahrainBangladeshBarbadosBelarusBelgiumBelizeBeninBermudaBhutanBoliviaBosnia and HerzegovinaBotswanaBrazilBrunei DarussalamBulgariaBurkina FasoBurundiCabo VerdeCambodiaCameroonCanadaCaribbean small statesCentral African RepublicCentral Europe and the BalticsChadChileChinaColombiaComorosCongo, Dem. Rep.Congo, Rep.Costa RicaCote d'IvoireCroatiaCubaCyprusCzech RepublicDenmarkDjiboutiDominicaDominican RepublicEarly-demographic dividendEast Asia & PacificEast Asia & Pacific (excluding high income)East Asia & Pacific (IDA & IBRD countries)EcuadorEgypt, Arab Rep.El SalvadorEquatorial GuineaEritreaEstoniaEthiopiaEuro areaEurope & Central AsiaEurope & Central Asia (excluding high income)Europe & Central Asia (IDA & IBRD countries)European UnionFijiFinlandFragile and conflict affected situationsFranceGabonGambia, TheGeorgiaGermanyGhanaGreeceGrenadaGuatemalaGuineaGuinea-BissauGuyanaHaitiHeavily indebted poor countries (HIPC)High incomeHondurasHong Kong SAR, ChinaHungaryIBRD onlyIcelandIDA & IBRD totalIDA blendIDA onlyIDA totalIndiaIndonesiaIran, Islamic Rep.IraqIrelandIsraelItalyJamaicaJapanJordanKazakhstanKenyaKiribatiKorea, Dem. People’s Rep.Korea, Rep.KuwaitKyrgyz RepublicLao PDRLate-demographic dividendLatin America & Caribbean Latin America & Caribbean (excluding high income)Latin America & the Caribbean (IDA & IBRD countries)LatviaLeast developed countries: UN classificationLebanonLesothoLiberiaLibyaLiechtensteinLithuaniaLow & middle incomeLow incomeLower middle incomeLuxembourgMacao SAR, ChinaMacedonia, FYRMadagascarMalawiMaldivesMaliMaltaMarshall IslandsMauritaniaMauritiusMexicoMicronesia, Fed. Sts.Middle East & North AfricaMiddle East & North Africa (excluding high income)Middle East & North Africa (IDA & IBRD countries)Middle incomeMoldovaMongoliaMontenegroMoroccoMozambiqueMyanmarNamibiaNauruNepalNetherlandsNew ZealandNicaraguaNigerNigeriaNorth AmericaNorwayOECD membersOmanOther small statesPacific island small statesPakistanPalauPanamaPapua New GuineaParaguayPeruPhilippinesPolandPortugalPost-demographic dividendPre-demographic dividendPuerto RicoQatarRomaniaRussian FederationRwandaSamoaSan MarinoSao Tome and PrincipeSaudi ArabiaSenegalSerbiaSeychellesSierra LeoneSlovak RepublicSloveniaSmall statesSolomon IslandsSouth AfricaSouth AsiaSouth Asia (IDA & IBRD)South SudanSpainSri LankaSt. Kitts and NevisSt. LuciaSt. Vincent and the GrenadinesSub-Saharan Africa Sub-Saharan Africa (excluding high income)Sub-Saharan Africa (IDA & IBRD countries)SudanSurinameSwazilandSwedenSwitzerlandSyrian Arab RepublicTajikistanTanzaniaThailandTimor-LesteTogoTongaTrinidad and TobagoTunisiaTurkeyTuvaluUgandaUkraineUnited Arab EmiratesUnited StatesUpper middle incomeUruguayUzbekistanVanuatuVenezuela, RBVietnamWest Bank and GazaWorldYemen, Rep.ZambiaZimbabwe Timeline:
This timeline shows a graph from 1971 to 2015 of Middle income. No data until 1970. Number of actual observations by date: 45.
Source name:
World Development Indicators
Source organization:
UNESCO Institute for Statistics
Categories, topics:
Education, Gender
Last updated:
apr 23, 2017
Indicators value changes by year
Minimum:
97.853
jan 1, 1971
Maximum:
112.289
jan 1, 2008
At the date of observation
Value
Absolute change
Change from previous value
jan 1, 1971
97.853
+97.853
0.0%
jan 1, 1972
99.15
+1.297
1.33%
jan 1, 1973
100.433
+1.282
1.29%
jan 1, 1974
101.632
+1.199
1.19%
jan 1, 1975
102.519
+0.887
0.87%
jan 1, 1976
103.602
+1.083
1.06%
jan 1, 1977
103.725
+0.123
0.12%
jan 1, 1978
104.892
+1.167
1.13%
jan 1, 1979
103.634
-1.258
-1.2%
jan 1, 1980
106.223
+2.589
2.5%
jan 1, 1981
105.299
-0.925
-0.87%
jan 1, 1982
105.278
-0.02
-0.02%
jan 1, 1983
105.026
-0.252
-0.24%
jan 1, 1984
107.023
+1.996
1.9%
jan 1, 1985
107.554
+0.532
0.5%
jan 1, 1986
107.469
-0.086
-0.08%
jan 1, 1987
107.12
-0.348
-0.32%
jan 1, 1988
105.622
-1.498
-1.4%
jan 1, 1989
105.097
-0.526
-0.5%
jan 1, 1990
103.36
-1.737
-1.65%
jan 1, 1991
104.992
+1.633
1.58%
jan 1, 1992
102.11
-2.882
-2.75%
jan 1, 1993
101.988
-0.122
-0.12%
jan 1, 1994
102.245
+0.257
0.25%
jan 1, 1995
102.485
+0.239
0.23%
jan 1, 1996
102.011
-0.474
-0.46%
jan 1, 1997
101.562
-0.449
-0.44%
jan 1, 1998
101.317
-0.245
-0.24%
jan 1, 1999
101.918
+0.601
0.59%
jan 1, 2000
101.649
-0.269
-0.26%
jan 1, 2001
102.348
+0.699
0.69%
jan 1, 2002
103.037
+0.689
0.67%
jan 1, 2003
104.506
+1.47
1.43%
jan 1, 2004
110.55
+6.044
5.78%
jan 1, 2005
111.377
+0.826
0.75%
jan 1, 2006
111.6
+0.223
0.2%
jan 1, 2007
111.518
-0.082
-0.07%
jan 1, 2008
112.289
+0.771
0.69%
jan 1, 2009
111.546
-0.743
-0.66%
jan 1, 2010
107.769
-3.777
-3.39%
jan 1, 2011
108.256
+0.487
0.45%
jan 1, 2012
106.526
-1.73
-1.6%
jan 1, 2013
105.717
-0.81
-0.76%
jan 1, 2014
105.178
-0.538
-0.51%
jan 1, 2015
104.591
-0.587
-0.56%
Ranking of countries by current statistics by years


Comments: