29
/
en
AIzaSyAYiBZKx7MnpbEhh9jyipgxe19OcubqV5w
April 1, 2024
107315
Colombia
COL
true
2
1
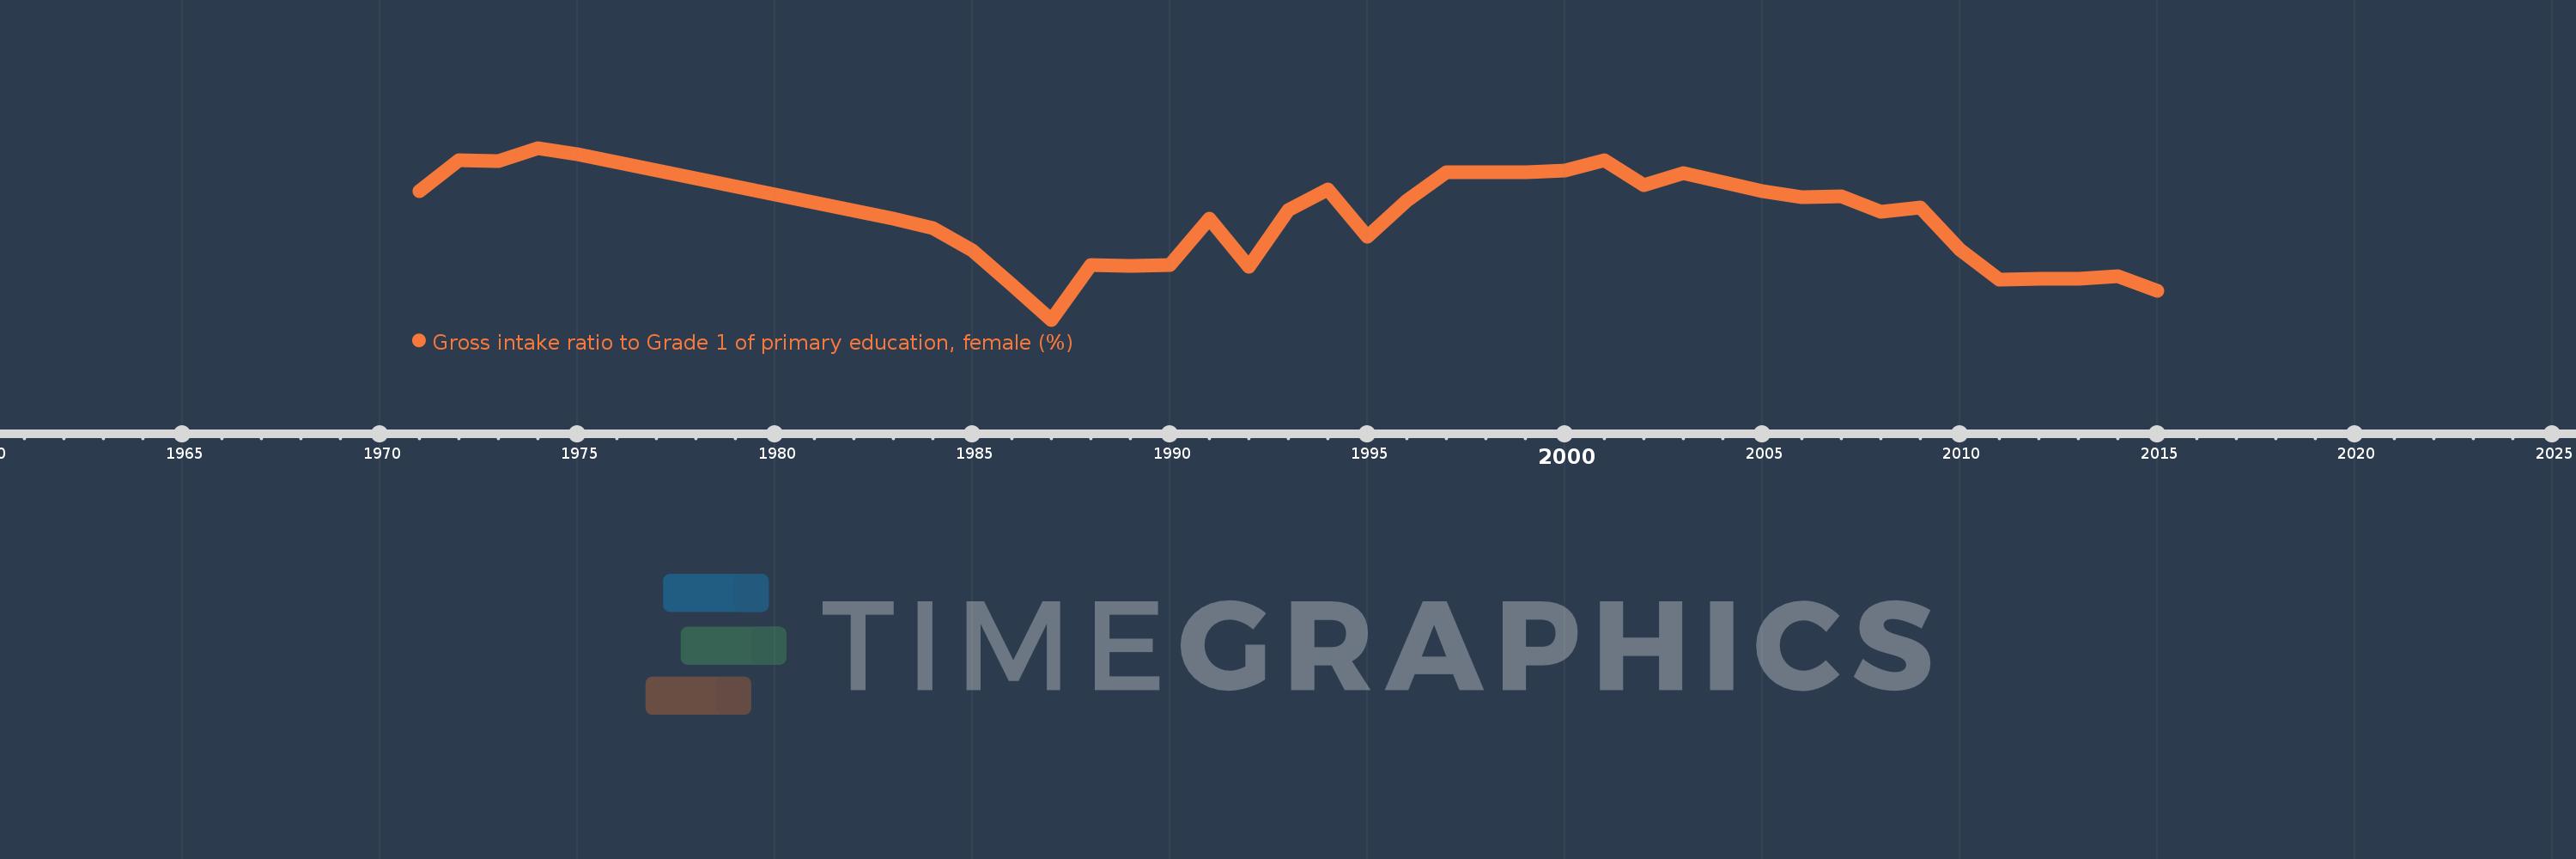
Gross intake ratio to Grade 1 of primary education, female (%)
2015,2014,2013,2012,2011,2010,2009,2008,2007,2006,2005,2003,2002,2001,2000,1999,1997,1996,1995,1994,1993,1992,1991,1990,1989,1988,1987,1986,1985,1984,1983,1975,1974,1973,1972,1971
This statistics in other country:
AfghanistanAlbaniaAlgeriaAngolaAntigua and BarbudaArab WorldArgentinaArmeniaArubaAustriaAzerbaijanBahamas, TheBahrainBangladeshBarbadosBelarusBelgiumBelizeBeninBermudaBhutanBoliviaBosnia and HerzegovinaBotswanaBrazilBrunei DarussalamBulgariaBurkina FasoBurundiCabo VerdeCambodiaCameroonCanadaCaribbean small statesCentral African RepublicCentral Europe and the BalticsChadChileChinaColombiaComorosCongo, Dem. Rep.Congo, Rep.Costa RicaCote d'IvoireCroatiaCubaCyprusCzech RepublicDenmarkDjiboutiDominicaDominican RepublicEarly-demographic dividendEast Asia & PacificEast Asia & Pacific (excluding high income)East Asia & Pacific (IDA & IBRD countries)EcuadorEgypt, Arab Rep.El SalvadorEquatorial GuineaEritreaEstoniaEthiopiaEuro areaEurope & Central AsiaEurope & Central Asia (excluding high income)Europe & Central Asia (IDA & IBRD countries)European UnionFijiFinlandFragile and conflict affected situationsFranceGabonGambia, TheGeorgiaGermanyGhanaGreeceGrenadaGuatemalaGuineaGuinea-BissauGuyanaHaitiHeavily indebted poor countries (HIPC)High incomeHondurasHong Kong SAR, ChinaHungaryIBRD onlyIcelandIDA & IBRD totalIDA blendIDA onlyIDA totalIndiaIndonesiaIran, Islamic Rep.IraqIrelandIsraelItalyJamaicaJapanJordanKazakhstanKenyaKiribatiKorea, Dem. People’s Rep.Korea, Rep.KuwaitKyrgyz RepublicLao PDRLate-demographic dividendLatin America & Caribbean Latin America & Caribbean (excluding high income)Latin America & the Caribbean (IDA & IBRD countries)LatviaLeast developed countries: UN classificationLebanonLesothoLiberiaLibyaLiechtensteinLithuaniaLow & middle incomeLow incomeLower middle incomeLuxembourgMacao SAR, ChinaMacedonia, FYRMadagascarMalawiMaldivesMaliMaltaMarshall IslandsMauritaniaMauritiusMexicoMicronesia, Fed. Sts.Middle East & North AfricaMiddle East & North Africa (excluding high income)Middle East & North Africa (IDA & IBRD countries)Middle incomeMoldovaMongoliaMontenegroMoroccoMozambiqueMyanmarNamibiaNauruNepalNetherlandsNew ZealandNicaraguaNigerNigeriaNorth AmericaNorwayOECD membersOmanOther small statesPacific island small statesPakistanPalauPanamaPapua New GuineaParaguayPeruPhilippinesPolandPortugalPost-demographic dividendPre-demographic dividendPuerto RicoQatarRomaniaRussian FederationRwandaSamoaSan MarinoSao Tome and PrincipeSaudi ArabiaSenegalSerbiaSeychellesSierra LeoneSlovak RepublicSloveniaSmall statesSolomon IslandsSouth AfricaSouth AsiaSouth Asia (IDA & IBRD)South SudanSpainSri LankaSt. Kitts and NevisSt. LuciaSt. Vincent and the GrenadinesSub-Saharan Africa Sub-Saharan Africa (excluding high income)Sub-Saharan Africa (IDA & IBRD countries)SudanSurinameSwazilandSwedenSwitzerlandSyrian Arab RepublicTajikistanTanzaniaThailandTimor-LesteTogoTongaTrinidad and TobagoTunisiaTurkeyTuvaluUgandaUkraineUnited Arab EmiratesUnited StatesUpper middle incomeUruguayUzbekistanVanuatuVenezuela, RBVietnamWest Bank and GazaWorldYemen, Rep.ZambiaZimbabwe Timeline:
This timeline shows a graph from 1971 to 2015 of Colombia. No data until 1970. Number of actual observations by date: 36.
Source name:
World Development Indicators
Source organization:
UNESCO Institute for Statistics
Categories, topics:
Education, Gender
Last updated:
apr 23, 2017
Indicators value changes by year
Minimum:
105.502
jan 1, 1987
Maximum:
148.799
jan 1, 1974
At the date of observation
Value
Absolute change
Change from previous value
jan 1, 1971
137.972
+137.972
0.0%
jan 1, 1972
145.719
+7.747
5.61%
jan 1, 1973
145.403
-0.315
-0.22%
jan 1, 1974
148.799
+3.396
2.34%
jan 1, 1975
147.296
-1.504
-1.01%
jan 1, 1983
131.071
-16.225
-11.02%
jan 1, 1984
128.635
-2.436
-1.86%
jan 1, 1985
123.006
-5.629
-4.38%
jan 1, 1986
114.398
-8.608
-7.0%
jan 1, 1987
105.502
-8.896
-7.78%
jan 1, 1988
119.209
+13.707
12.99%
jan 1, 1989
119.081
-0.128
-0.11%
jan 1, 1990
119.239
+0.158
0.13%
jan 1, 1991
130.965
+11.727
9.83%
jan 1, 1992
118.795
-12.17
-9.29%
jan 1, 1993
133.062
+14.267
12.01%
jan 1, 1994
138.26
+5.198
3.91%
jan 1, 1995
126.468
-11.792
-8.53%
jan 1, 1996
135.578
+9.11
7.2%
jan 1, 1997
142.752
+7.174
5.29%
jan 1, 1999
142.571
-0.181
-0.13%
jan 1, 2000
143.213
+0.642
0.45%
jan 1, 2001
145.783
+2.57
1.79%
jan 1, 2002
139.411
-6.372
-4.37%
jan 1, 2003
142.388
+2.976
2.13%
jan 1, 2005
137.932
-4.455
-3.13%
jan 1, 2006
136.463
-1.469
-1.06%
jan 1, 2007
136.527
+0.064
0.05%
jan 1, 2008
132.647
-3.88
-2.84%
jan 1, 2009
133.815
+1.168
0.88%
jan 1, 2010
123.285
-10.53
-7.87%
jan 1, 2011
115.563
-7.722
-6.26%
jan 1, 2012
115.874
+0.311
0.27%
jan 1, 2013
115.835
-0.039
-0.03%
jan 1, 2014
116.557
+0.722
0.62%
jan 1, 2015
112.879
-3.678
-3.16%
Ranking of countries by current statistics by years


Comments: