29
/
en
AIzaSyAYiBZKx7MnpbEhh9jyipgxe19OcubqV5w
April 1, 2024
24939
Caribbean small states
CSS
false
2
1
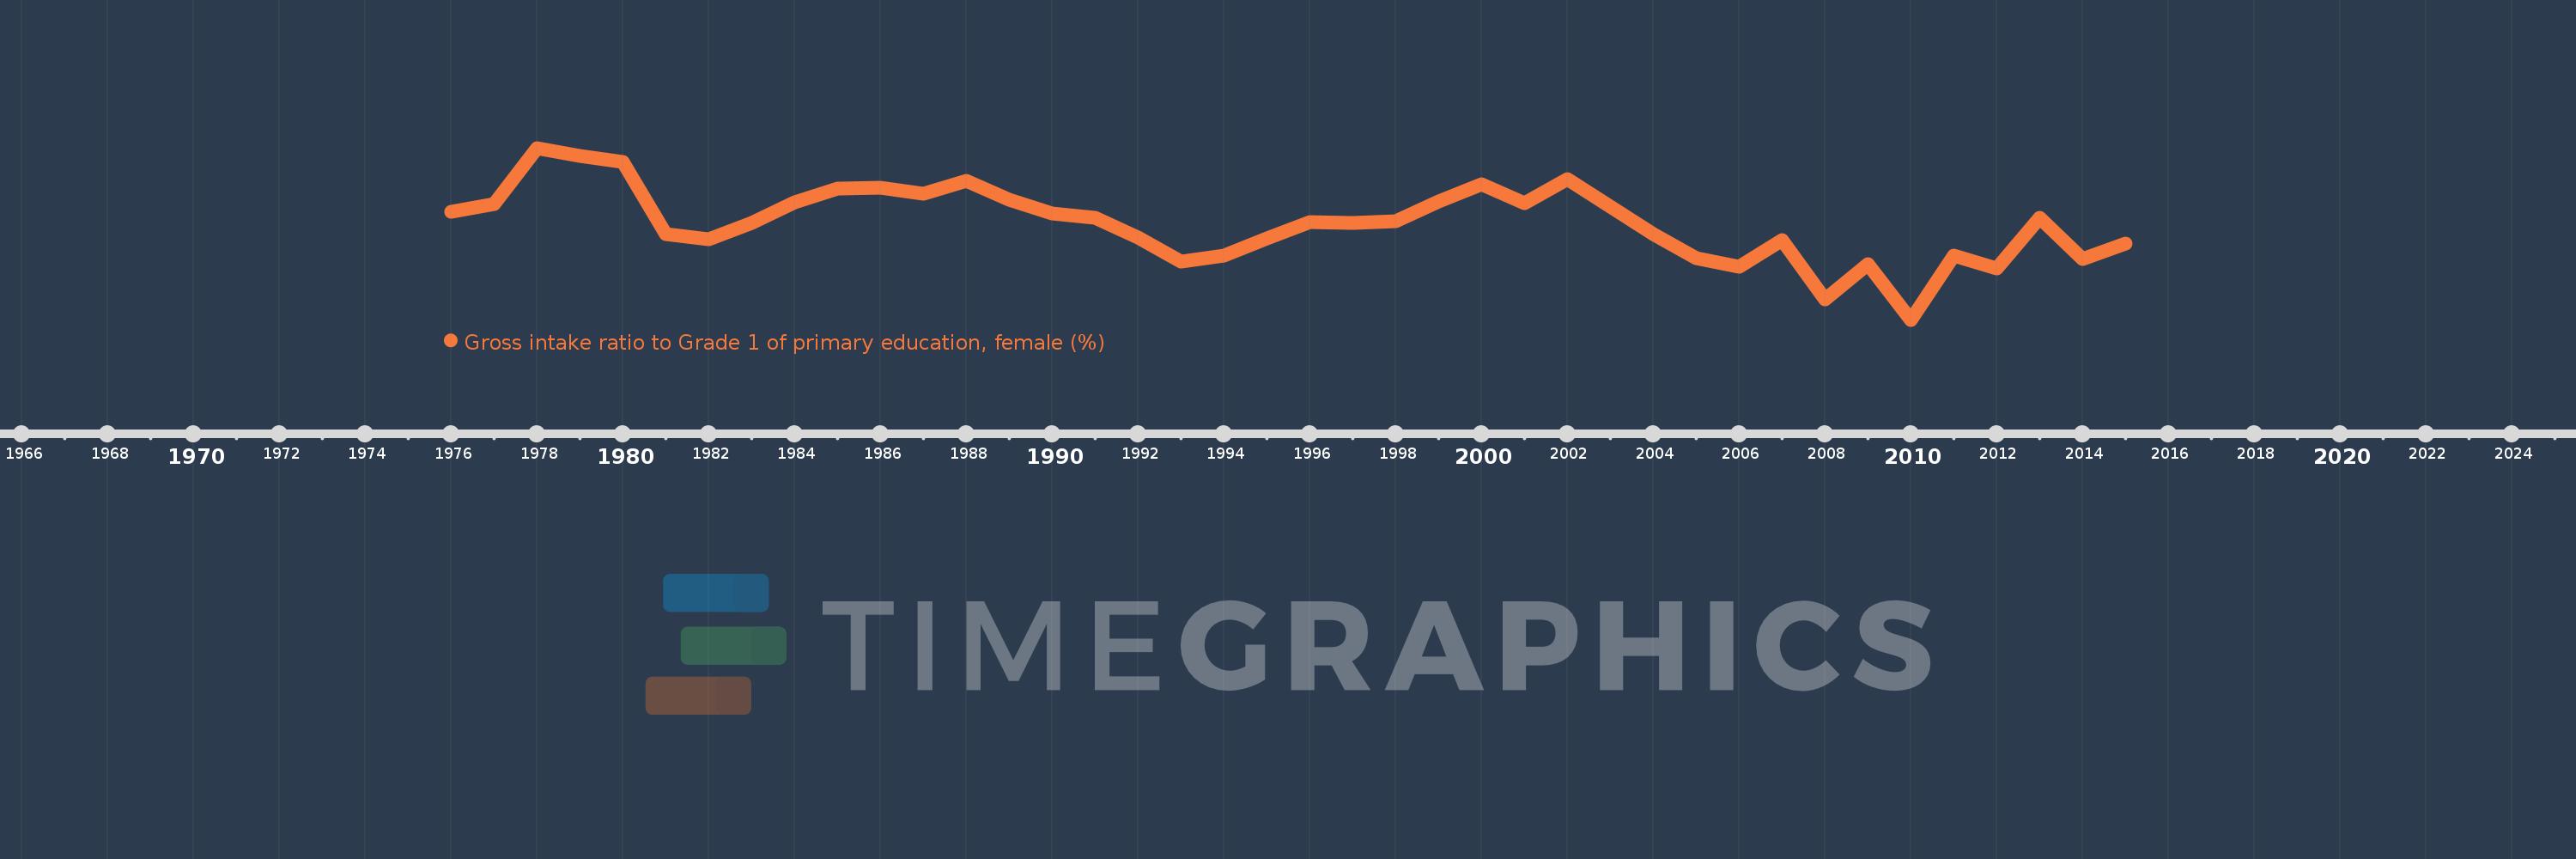
Gross intake ratio to Grade 1 of primary education, female (%)
2015,2014,2013,2012,2011,2010,2009,2008,2007,2006,2005,2004,2003,2002,2001,2000,1999,1998,1997,1996,1995,1994,1993,1992,1991,1990,1989,1988,1987,1986,1985,1984,1983,1982,1981,1980,1979,1978,1977,1976
This statistics in other country:
AfghanistanAlbaniaAlgeriaAngolaAntigua and BarbudaArab WorldArgentinaArmeniaArubaAustriaAzerbaijanBahamas, TheBahrainBangladeshBarbadosBelarusBelgiumBelizeBeninBermudaBhutanBoliviaBosnia and HerzegovinaBotswanaBrazilBrunei DarussalamBulgariaBurkina FasoBurundiCabo VerdeCambodiaCameroonCanadaCaribbean small statesCentral African RepublicCentral Europe and the BalticsChadChileChinaColombiaComorosCongo, Dem. Rep.Congo, Rep.Costa RicaCote d'IvoireCroatiaCubaCyprusCzech RepublicDenmarkDjiboutiDominicaDominican RepublicEarly-demographic dividendEast Asia & PacificEast Asia & Pacific (excluding high income)East Asia & Pacific (IDA & IBRD countries)EcuadorEgypt, Arab Rep.El SalvadorEquatorial GuineaEritreaEstoniaEthiopiaEuro areaEurope & Central AsiaEurope & Central Asia (excluding high income)Europe & Central Asia (IDA & IBRD countries)European UnionFijiFinlandFragile and conflict affected situationsFranceGabonGambia, TheGeorgiaGermanyGhanaGreeceGrenadaGuatemalaGuineaGuinea-BissauGuyanaHaitiHeavily indebted poor countries (HIPC)High incomeHondurasHong Kong SAR, ChinaHungaryIBRD onlyIcelandIDA & IBRD totalIDA blendIDA onlyIDA totalIndiaIndonesiaIran, Islamic Rep.IraqIrelandIsraelItalyJamaicaJapanJordanKazakhstanKenyaKiribatiKorea, Dem. People’s Rep.Korea, Rep.KuwaitKyrgyz RepublicLao PDRLate-demographic dividendLatin America & Caribbean Latin America & Caribbean (excluding high income)Latin America & the Caribbean (IDA & IBRD countries)LatviaLeast developed countries: UN classificationLebanonLesothoLiberiaLibyaLiechtensteinLithuaniaLow & middle incomeLow incomeLower middle incomeLuxembourgMacao SAR, ChinaMacedonia, FYRMadagascarMalawiMaldivesMaliMaltaMarshall IslandsMauritaniaMauritiusMexicoMicronesia, Fed. Sts.Middle East & North AfricaMiddle East & North Africa (excluding high income)Middle East & North Africa (IDA & IBRD countries)Middle incomeMoldovaMongoliaMontenegroMoroccoMozambiqueMyanmarNamibiaNauruNepalNetherlandsNew ZealandNicaraguaNigerNigeriaNorth AmericaNorwayOECD membersOmanOther small statesPacific island small statesPakistanPalauPanamaPapua New GuineaParaguayPeruPhilippinesPolandPortugalPost-demographic dividendPre-demographic dividendPuerto RicoQatarRomaniaRussian FederationRwandaSamoaSan MarinoSao Tome and PrincipeSaudi ArabiaSenegalSerbiaSeychellesSierra LeoneSlovak RepublicSloveniaSmall statesSolomon IslandsSouth AfricaSouth AsiaSouth Asia (IDA & IBRD)South SudanSpainSri LankaSt. Kitts and NevisSt. LuciaSt. Vincent and the GrenadinesSub-Saharan Africa Sub-Saharan Africa (excluding high income)Sub-Saharan Africa (IDA & IBRD countries)SudanSurinameSwazilandSwedenSwitzerlandSyrian Arab RepublicTajikistanTanzaniaThailandTimor-LesteTogoTongaTrinidad and TobagoTunisiaTurkeyTuvaluUgandaUkraineUnited Arab EmiratesUnited StatesUpper middle incomeUruguayUzbekistanVanuatuVenezuela, RBVietnamWest Bank and GazaWorldYemen, Rep.ZambiaZimbabwe Timeline:
This timeline shows a graph from 1976 to 2015 of Caribbean small states. No data until 1975. Number of actual observations by date: 40.
Source name:
World Development Indicators
Source organization:
UNESCO Institute for Statistics
Categories, topics:
Education, Gender
Last updated:
apr 23, 2017
Indicators value changes by year
Minimum:
88.903
jan 1, 2010
Maximum:
103.926
jan 1, 1978
At the date of observation
Value
Absolute change
Change from previous value
jan 1, 1976
98.331
+98.331
0.0%
jan 1, 1977
99.0
+0.669
0.68%
jan 1, 1978
103.926
+4.926
4.98%
jan 1, 1979
103.204
-0.722
-0.69%
jan 1, 1980
102.698
-0.507
-0.49%
jan 1, 1981
96.425
-6.273
-6.11%
jan 1, 1982
95.933
-0.492
-0.51%
jan 1, 1983
97.346
+1.413
1.47%
jan 1, 1984
99.154
+1.808
1.86%
jan 1, 1985
100.408
+1.254
1.27%
jan 1, 1986
100.476
+0.068
0.07%
jan 1, 1987
99.945
-0.531
-0.53%
jan 1, 1988
101.014
+1.069
1.07%
jan 1, 1989
99.383
-1.631
-1.61%
jan 1, 1990
98.161
-1.222
-1.23%
jan 1, 1991
97.814
-0.347
-0.35%
jan 1, 1992
96.063
-1.75
-1.79%
jan 1, 1993
93.975
-2.088
-2.17%
jan 1, 1994
94.481
+0.506
0.54%
jan 1, 1995
95.986
+1.505
1.59%
jan 1, 1996
97.461
+1.474
1.54%
jan 1, 1997
97.387
-0.074
-0.08%
jan 1, 1998
97.497
+0.11
0.11%
jan 1, 1999
99.267
+1.77
1.82%
jan 1, 2000
100.747
+1.48
1.49%
jan 1, 2001
99.126
-1.622
-1.61%
jan 1, 2002
101.211
+2.086
2.1%
jan 1, 2003
98.811
-2.4
-2.37%
jan 1, 2004
96.395
-2.417
-2.45%
jan 1, 2005
94.303
-2.091
-2.17%
jan 1, 2006
93.56
-0.743
-0.79%
jan 1, 2007
95.88
+2.32
2.48%
jan 1, 2008
90.653
-5.227
-5.45%
jan 1, 2009
93.754
+3.101
3.42%
jan 1, 2010
88.903
-4.851
-5.17%
jan 1, 2011
94.53
+5.626
6.33%
jan 1, 2012
93.367
-1.162
-1.23%
jan 1, 2013
97.827
+4.46
4.78%
jan 1, 2014
94.205
-3.622
-3.7%
jan 1, 2015
95.565
+1.359
1.44%
Ranking of countries by current statistics by years


Comments: