29
/
en
AIzaSyAYiBZKx7MnpbEhh9jyipgxe19OcubqV5w
April 1, 2024
177735
Lesotho
LSO
true
2
1
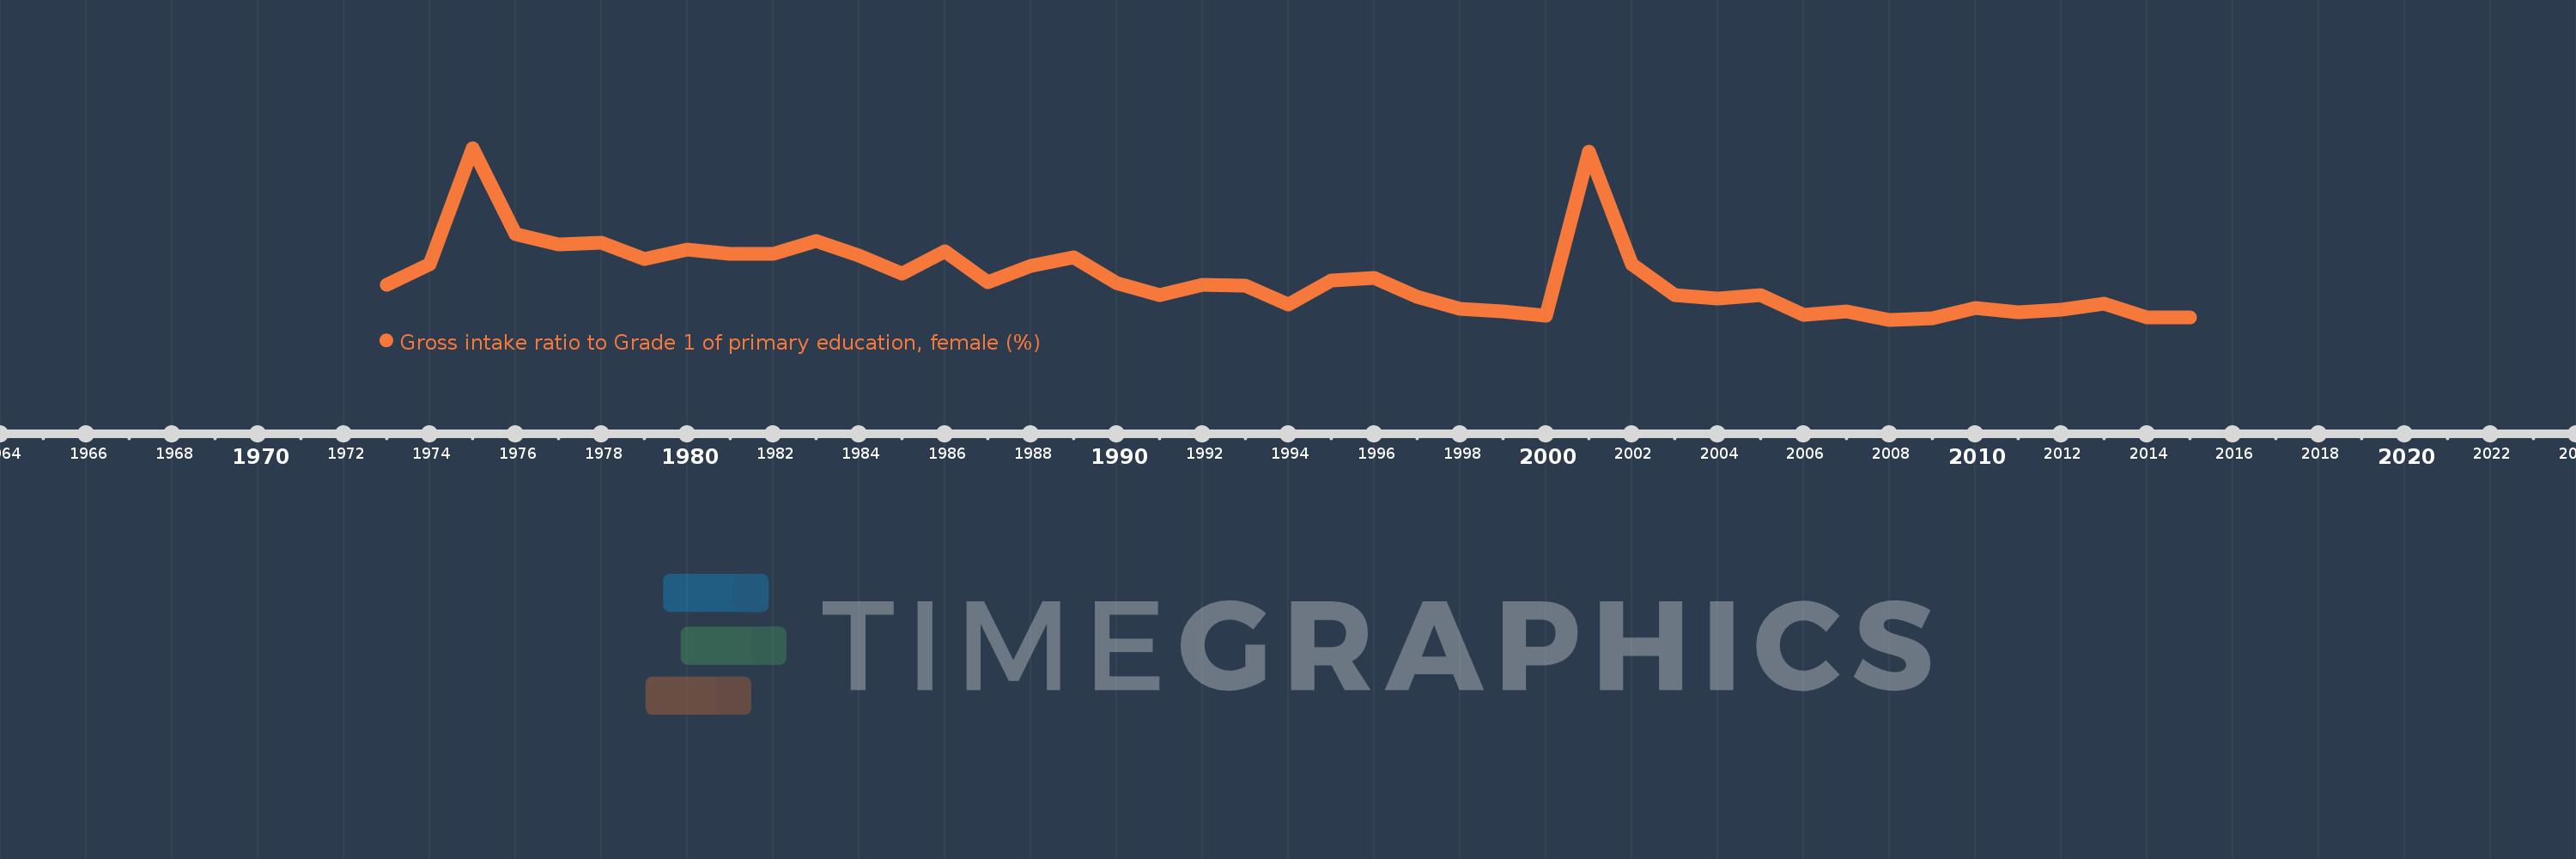
Gross intake ratio to Grade 1 of primary education, female (%)
2015,2014,2013,2012,2011,2010,2009,2008,2007,2006,2005,2004,2003,2002,2001,2000,1999,1998,1997,1996,1995,1994,1993,1992,1991,1990,1989,1988,1987,1986,1985,1984,1983,1982,1981,1980,1979,1978,1977,1976,1975,1974,1973
This statistics in other country:
AfghanistanAlbaniaAlgeriaAngolaAntigua and BarbudaArab WorldArgentinaArmeniaArubaAustriaAzerbaijanBahamas, TheBahrainBangladeshBarbadosBelarusBelgiumBelizeBeninBermudaBhutanBoliviaBosnia and HerzegovinaBotswanaBrazilBrunei DarussalamBulgariaBurkina FasoBurundiCabo VerdeCambodiaCameroonCanadaCaribbean small statesCentral African RepublicCentral Europe and the BalticsChadChileChinaColombiaComorosCongo, Dem. Rep.Congo, Rep.Costa RicaCote d'IvoireCroatiaCubaCyprusCzech RepublicDenmarkDjiboutiDominicaDominican RepublicEarly-demographic dividendEast Asia & PacificEast Asia & Pacific (excluding high income)East Asia & Pacific (IDA & IBRD countries)EcuadorEgypt, Arab Rep.El SalvadorEquatorial GuineaEritreaEstoniaEthiopiaEuro areaEurope & Central AsiaEurope & Central Asia (excluding high income)Europe & Central Asia (IDA & IBRD countries)European UnionFijiFinlandFragile and conflict affected situationsFranceGabonGambia, TheGeorgiaGermanyGhanaGreeceGrenadaGuatemalaGuineaGuinea-BissauGuyanaHaitiHeavily indebted poor countries (HIPC)High incomeHondurasHong Kong SAR, ChinaHungaryIBRD onlyIcelandIDA & IBRD totalIDA blendIDA onlyIDA totalIndiaIndonesiaIran, Islamic Rep.IraqIrelandIsraelItalyJamaicaJapanJordanKazakhstanKenyaKiribatiKorea, Dem. People’s Rep.Korea, Rep.KuwaitKyrgyz RepublicLao PDRLate-demographic dividendLatin America & Caribbean Latin America & Caribbean (excluding high income)Latin America & the Caribbean (IDA & IBRD countries)LatviaLeast developed countries: UN classificationLebanonLesothoLiberiaLibyaLiechtensteinLithuaniaLow & middle incomeLow incomeLower middle incomeLuxembourgMacao SAR, ChinaMacedonia, FYRMadagascarMalawiMaldivesMaliMaltaMarshall IslandsMauritaniaMauritiusMexicoMicronesia, Fed. Sts.Middle East & North AfricaMiddle East & North Africa (excluding high income)Middle East & North Africa (IDA & IBRD countries)Middle incomeMoldovaMongoliaMontenegroMoroccoMozambiqueMyanmarNamibiaNauruNepalNetherlandsNew ZealandNicaraguaNigerNigeriaNorth AmericaNorwayOECD membersOmanOther small statesPacific island small statesPakistanPalauPanamaPapua New GuineaParaguayPeruPhilippinesPolandPortugalPost-demographic dividendPre-demographic dividendPuerto RicoQatarRomaniaRussian FederationRwandaSamoaSan MarinoSao Tome and PrincipeSaudi ArabiaSenegalSerbiaSeychellesSierra LeoneSlovak RepublicSloveniaSmall statesSolomon IslandsSouth AfricaSouth AsiaSouth Asia (IDA & IBRD)South SudanSpainSri LankaSt. Kitts and NevisSt. LuciaSt. Vincent and the GrenadinesSub-Saharan Africa Sub-Saharan Africa (excluding high income)Sub-Saharan Africa (IDA & IBRD countries)SudanSurinameSwazilandSwedenSwitzerlandSyrian Arab RepublicTajikistanTanzaniaThailandTimor-LesteTogoTongaTrinidad and TobagoTunisiaTurkeyTuvaluUgandaUkraineUnited Arab EmiratesUnited StatesUpper middle incomeUruguayUzbekistanVanuatuVenezuela, RBVietnamWest Bank and GazaWorldYemen, Rep.ZambiaZimbabwe Timeline:
This timeline shows a graph from 1973 to 2015 of Lesotho. No data until 1972. Number of actual observations by date: 43.
Source name:
World Development Indicators
Source organization:
UNESCO Institute for Statistics
Categories, topics:
Education, Gender
Last updated:
apr 23, 2017
Indicators value changes by year
Minimum:
99.259
jan 1, 2008
Maximum:
183.646
jan 1, 1975
At the date of observation
Value
Absolute change
Change from previous value
jan 1, 1973
116.393
+116.393
0.0%
jan 1, 1974
126.363
+9.97
8.57%
jan 1, 1975
183.646
+57.283
45.33%
jan 1, 1976
141.178
-42.468
-23.12%
jan 1, 1977
136.071
-5.107
-3.62%
jan 1, 1978
137.264
+1.193
0.88%
jan 1, 1979
128.982
-8.282
-6.03%
jan 1, 1980
133.691
+4.709
3.65%
jan 1, 1981
131.643
-2.047
-1.53%
jan 1, 1982
131.547
-0.096
-0.07%
jan 1, 1983
137.906
+6.358
4.83%
jan 1, 1984
130.826
-7.08
-5.13%
jan 1, 1985
122.077
-8.75
-6.69%
jan 1, 1986
132.904
+10.827
8.87%
jan 1, 1987
117.867
-15.037
-11.31%
jan 1, 1988
125.675
+7.809
6.63%
jan 1, 1989
129.914
+4.238
3.37%
jan 1, 1990
117.131
-12.783
-9.84%
jan 1, 1991
111.269
-5.861
-5.0%
jan 1, 1992
116.52
+5.251
4.72%
jan 1, 1993
115.998
-0.523
-0.45%
jan 1, 1994
106.9
-9.098
-7.84%
jan 1, 1995
118.445
+11.545
10.8%
jan 1, 1996
119.725
+1.28
1.08%
jan 1, 1997
110.733
-8.992
-7.51%
jan 1, 1998
104.711
-6.022
-5.44%
jan 1, 1999
103.172
-1.539
-1.47%
jan 1, 2000
101.056
-2.117
-2.05%
jan 1, 2001
182.021
+80.965
80.12%
jan 1, 2002
126.421
-55.6
-30.55%
jan 1, 2003
111.162
-15.259
-12.07%
jan 1, 2004
109.632
-1.53
-1.38%
jan 1, 2005
111.368
+1.736
1.58%
jan 1, 2006
101.619
-9.749
-8.75%
jan 1, 2007
103.208
+1.589
1.56%
jan 1, 2008
99.259
-3.949
-3.83%
jan 1, 2009
100.12
+0.861
0.87%
jan 1, 2010
105.181
+5.061
5.06%
jan 1, 2011
103.004
-2.177
-2.07%
jan 1, 2012
104.203
+1.199
1.16%
jan 1, 2013
107.204
+3.001
2.88%
jan 1, 2014
100.376
-6.828
-6.37%
jan 1, 2015
100.489
+0.113
0.11%
Ranking of countries by current statistics by years


Comments: