29
/
en
AIzaSyAYiBZKx7MnpbEhh9jyipgxe19OcubqV5w
April 1, 2024
170014
Korea, Rep.
KOR
true
2
1
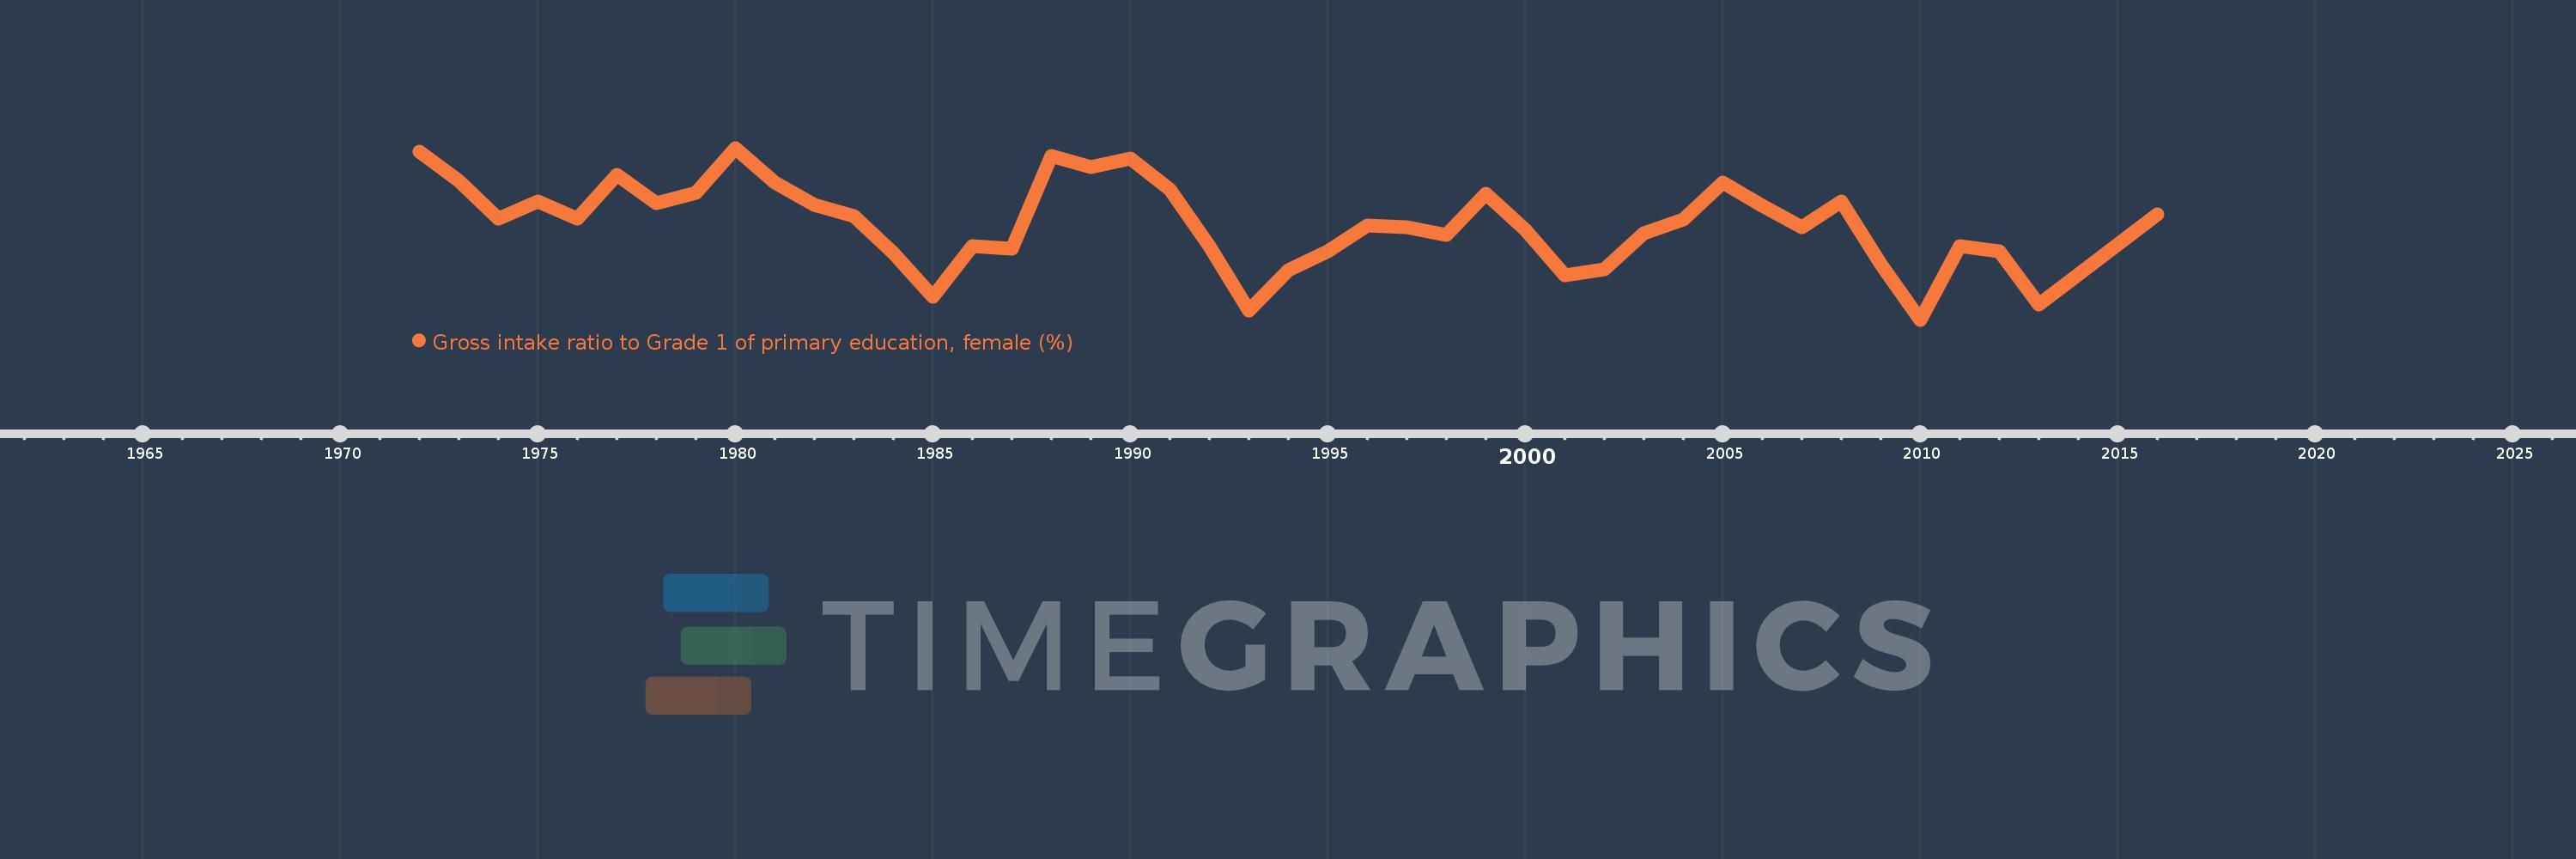
Gross intake ratio to Grade 1 of primary education, female (%)
2016,2013,2012,2011,2010,2009,2008,2007,2006,2005,2004,2003,2002,2001,2000,1999,1998,1997,1996,1995,1994,1993,1992,1991,1990,1989,1988,1987,1986,1985,1984,1983,1982,1981,1980,1979,1978,1977,1976,1975,1974,1973,1972
This statistics in other country:
AfghanistanAlbaniaAlgeriaAngolaAntigua and BarbudaArab WorldArgentinaArmeniaArubaAustriaAzerbaijanBahamas, TheBahrainBangladeshBarbadosBelarusBelgiumBelizeBeninBermudaBhutanBoliviaBosnia and HerzegovinaBotswanaBrazilBrunei DarussalamBulgariaBurkina FasoBurundiCabo VerdeCambodiaCameroonCanadaCaribbean small statesCentral African RepublicCentral Europe and the BalticsChadChileChinaColombiaComorosCongo, Dem. Rep.Congo, Rep.Costa RicaCote d'IvoireCroatiaCubaCyprusCzech RepublicDenmarkDjiboutiDominicaDominican RepublicEarly-demographic dividendEast Asia & PacificEast Asia & Pacific (excluding high income)East Asia & Pacific (IDA & IBRD countries)EcuadorEgypt, Arab Rep.El SalvadorEquatorial GuineaEritreaEstoniaEthiopiaEuro areaEurope & Central AsiaEurope & Central Asia (excluding high income)Europe & Central Asia (IDA & IBRD countries)European UnionFijiFinlandFragile and conflict affected situationsFranceGabonGambia, TheGeorgiaGermanyGhanaGreeceGrenadaGuatemalaGuineaGuinea-BissauGuyanaHaitiHeavily indebted poor countries (HIPC)High incomeHondurasHong Kong SAR, ChinaHungaryIBRD onlyIcelandIDA & IBRD totalIDA blendIDA onlyIDA totalIndiaIndonesiaIran, Islamic Rep.IraqIrelandIsraelItalyJamaicaJapanJordanKazakhstanKenyaKiribatiKorea, Dem. People’s Rep.Korea, Rep.KuwaitKyrgyz RepublicLao PDRLate-demographic dividendLatin America & Caribbean Latin America & Caribbean (excluding high income)Latin America & the Caribbean (IDA & IBRD countries)LatviaLeast developed countries: UN classificationLebanonLesothoLiberiaLibyaLiechtensteinLithuaniaLow & middle incomeLow incomeLower middle incomeLuxembourgMacao SAR, ChinaMacedonia, FYRMadagascarMalawiMaldivesMaliMaltaMarshall IslandsMauritaniaMauritiusMexicoMicronesia, Fed. Sts.Middle East & North AfricaMiddle East & North Africa (excluding high income)Middle East & North Africa (IDA & IBRD countries)Middle incomeMoldovaMongoliaMontenegroMoroccoMozambiqueMyanmarNamibiaNauruNepalNetherlandsNew ZealandNicaraguaNigerNigeriaNorth AmericaNorwayOECD membersOmanOther small statesPacific island small statesPakistanPalauPanamaPapua New GuineaParaguayPeruPhilippinesPolandPortugalPost-demographic dividendPre-demographic dividendPuerto RicoQatarRomaniaRussian FederationRwandaSamoaSan MarinoSao Tome and PrincipeSaudi ArabiaSenegalSerbiaSeychellesSierra LeoneSlovak RepublicSloveniaSmall statesSolomon IslandsSouth AfricaSouth AsiaSouth Asia (IDA & IBRD)South SudanSpainSri LankaSt. Kitts and NevisSt. LuciaSt. Vincent and the GrenadinesSub-Saharan Africa Sub-Saharan Africa (excluding high income)Sub-Saharan Africa (IDA & IBRD countries)SudanSurinameSwazilandSwedenSwitzerlandSyrian Arab RepublicTajikistanTanzaniaThailandTimor-LesteTogoTongaTrinidad and TobagoTunisiaTurkeyTuvaluUgandaUkraineUnited Arab EmiratesUnited StatesUpper middle incomeUruguayUzbekistanVanuatuVenezuela, RBVietnamWest Bank and GazaWorldYemen, Rep.ZambiaZimbabwe Timeline:
This timeline shows a graph from 1972 to 2016 of Korea, Rep.. No data until 1971. Number of actual observations by date: 43.
Source name:
World Development Indicators
Source organization:
UNESCO Institute for Statistics
Categories, topics:
Education, Gender
Last updated:
apr 23, 2017
Indicators value changes by year
Minimum:
92.948
jan 1, 2010
Maximum:
114.976
jan 1, 1980
At the date of observation
Value
Absolute change
Change from previous value
jan 1, 1972
114.51
+114.51
0.0%
jan 1, 1973
110.76
-3.75
-3.27%
jan 1, 1974
105.921
-4.839
-4.37%
jan 1, 1975
108.144
+2.223
2.1%
jan 1, 1976
105.868
-2.276
-2.1%
jan 1, 1977
111.527
+5.659
5.35%
jan 1, 1978
107.839
-3.688
-3.31%
jan 1, 1979
109.221
+1.382
1.28%
jan 1, 1980
114.976
+5.755
5.27%
jan 1, 1981
110.59
-4.386
-3.81%
jan 1, 1982
107.674
-2.916
-2.64%
jan 1, 1983
106.251
-1.423
-1.32%
jan 1, 1984
101.491
-4.759
-4.48%
jan 1, 1985
95.915
-5.576
-5.49%
jan 1, 1986
102.373
+6.459
6.73%
jan 1, 1987
102.091
-0.283
-0.28%
jan 1, 1988
113.946
+11.856
11.61%
jan 1, 1989
112.53
-1.416
-1.24%
jan 1, 1990
113.634
+1.104
0.98%
jan 1, 1991
109.637
-3.997
-3.52%
jan 1, 1992
102.348
-7.289
-6.65%
jan 1, 1993
94.135
-8.213
-8.02%
jan 1, 1994
99.319
+5.185
5.51%
jan 1, 1995
101.704
+2.384
2.4%
jan 1, 1996
105.06
+3.357
3.3%
jan 1, 1997
104.83
-0.23
-0.22%
jan 1, 1998
103.827
-1.004
-0.96%
jan 1, 1999
109.123
+5.297
5.1%
jan 1, 2000
104.448
-4.675
-4.28%
jan 1, 2001
98.671
-5.777
-5.53%
jan 1, 2002
99.401
+0.73
0.74%
jan 1, 2003
104.005
+4.604
4.63%
jan 1, 2004
105.854
+1.849
1.78%
jan 1, 2005
110.483
+4.629
4.37%
jan 1, 2006
107.527
-2.956
-2.68%
jan 1, 2007
104.803
-2.724
-2.53%
jan 1, 2008
108.143
+3.34
3.19%
jan 1, 2009
100.122
-8.022
-7.42%
jan 1, 2010
92.948
-7.173
-7.16%
jan 1, 2011
102.367
+9.419
10.13%
jan 1, 2012
101.78
-0.586
-0.57%
jan 1, 2013
94.939
-6.841
-6.72%
jan 1, 2016
106.48
+11.541
12.16%
Ranking of countries by current statistics by years


Comments: