29
/
en
AIzaSyAYiBZKx7MnpbEhh9jyipgxe19OcubqV5w
April 1, 2024
202988
Mozambique
MOZ
true
2
1
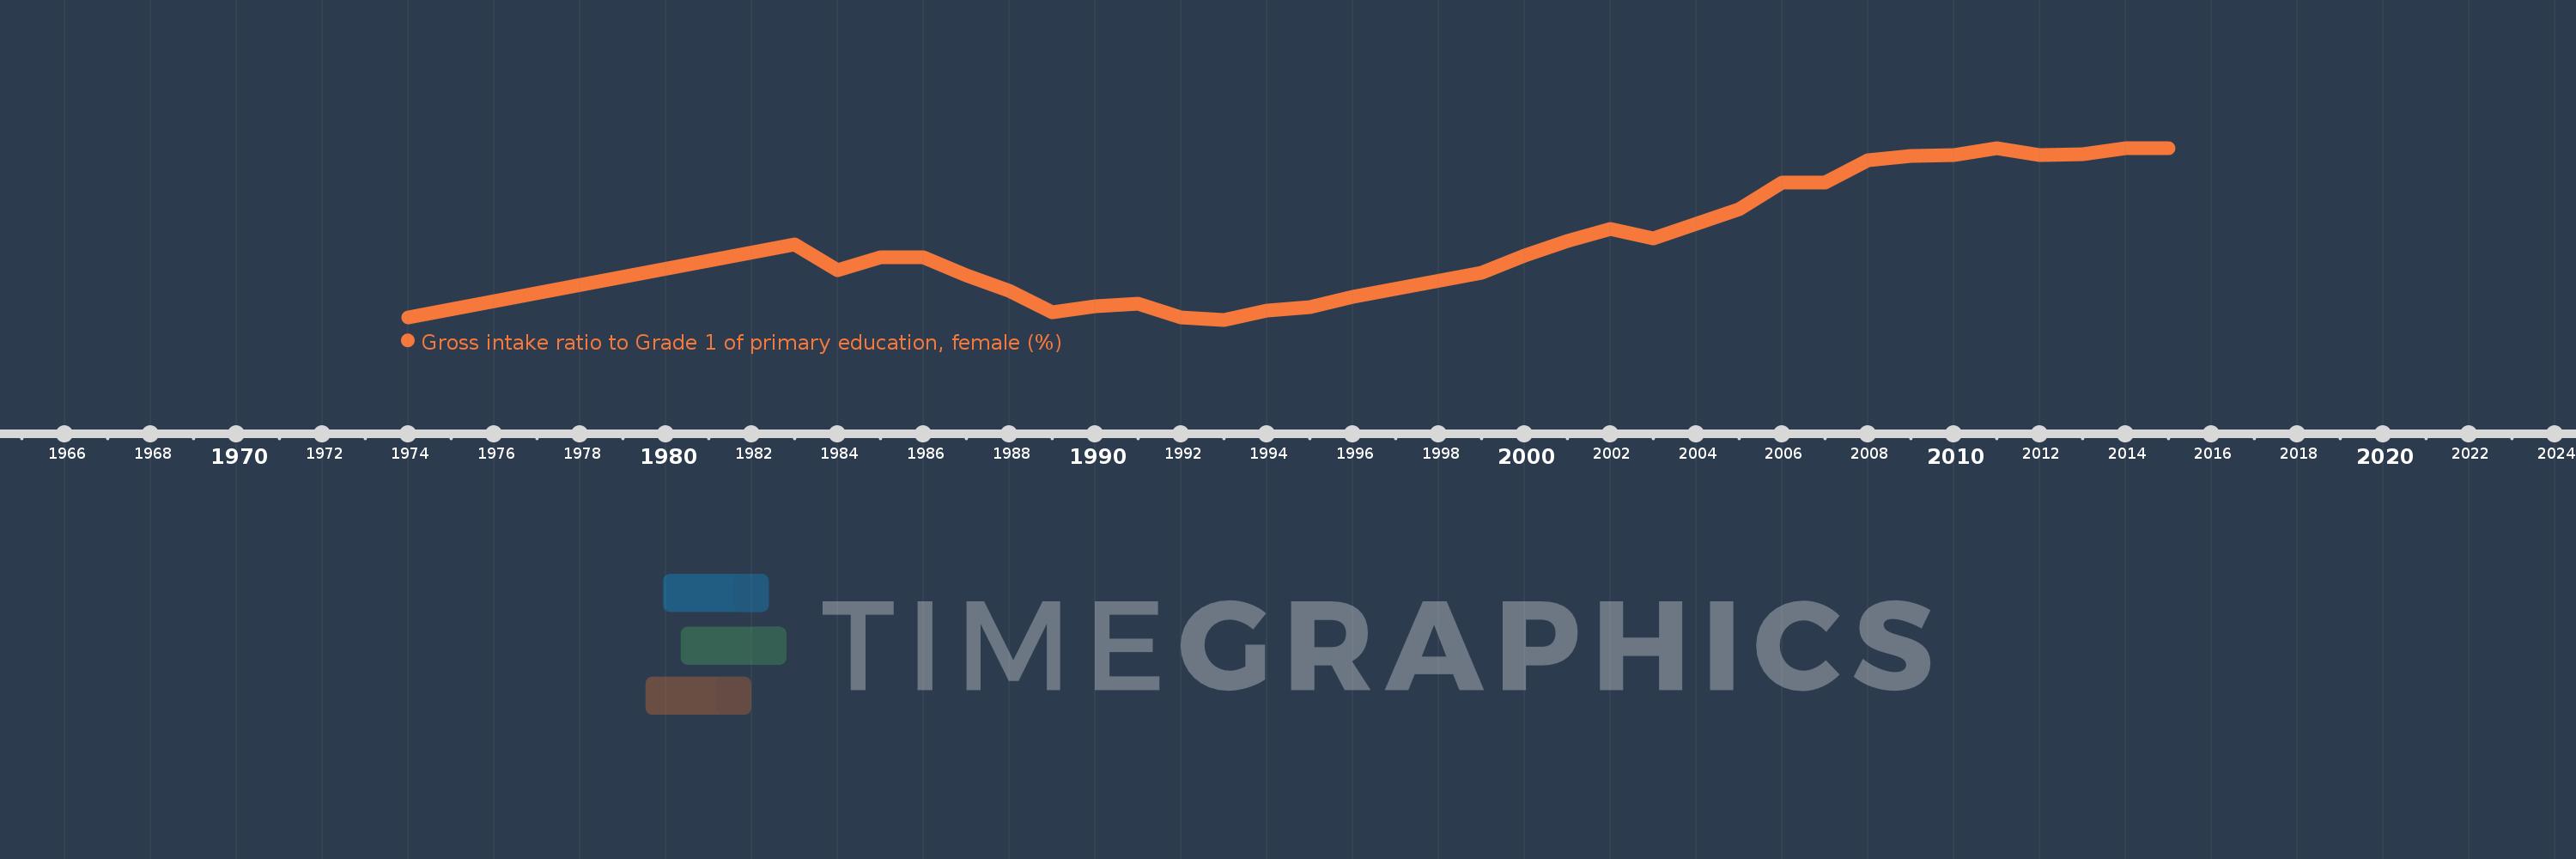
Gross intake ratio to Grade 1 of primary education, female (%)
2015,2014,2013,2012,2011,2010,2009,2008,2007,2006,2005,2003,2002,2001,2000,1999,1996,1995,1994,1993,1992,1991,1990,1989,1988,1987,1986,1985,1984,1983,1974
This statistics in other country:
AfghanistanAlbaniaAlgeriaAngolaAntigua and BarbudaArab WorldArgentinaArmeniaArubaAustriaAzerbaijanBahamas, TheBahrainBangladeshBarbadosBelarusBelgiumBelizeBeninBermudaBhutanBoliviaBosnia and HerzegovinaBotswanaBrazilBrunei DarussalamBulgariaBurkina FasoBurundiCabo VerdeCambodiaCameroonCanadaCaribbean small statesCentral African RepublicCentral Europe and the BalticsChadChileChinaColombiaComorosCongo, Dem. Rep.Congo, Rep.Costa RicaCote d'IvoireCroatiaCubaCyprusCzech RepublicDenmarkDjiboutiDominicaDominican RepublicEarly-demographic dividendEast Asia & PacificEast Asia & Pacific (excluding high income)East Asia & Pacific (IDA & IBRD countries)EcuadorEgypt, Arab Rep.El SalvadorEquatorial GuineaEritreaEstoniaEthiopiaEuro areaEurope & Central AsiaEurope & Central Asia (excluding high income)Europe & Central Asia (IDA & IBRD countries)European UnionFijiFinlandFragile and conflict affected situationsFranceGabonGambia, TheGeorgiaGermanyGhanaGreeceGrenadaGuatemalaGuineaGuinea-BissauGuyanaHaitiHeavily indebted poor countries (HIPC)High incomeHondurasHong Kong SAR, ChinaHungaryIBRD onlyIcelandIDA & IBRD totalIDA blendIDA onlyIDA totalIndiaIndonesiaIran, Islamic Rep.IraqIrelandIsraelItalyJamaicaJapanJordanKazakhstanKenyaKiribatiKorea, Dem. People’s Rep.Korea, Rep.KuwaitKyrgyz RepublicLao PDRLate-demographic dividendLatin America & Caribbean Latin America & Caribbean (excluding high income)Latin America & the Caribbean (IDA & IBRD countries)LatviaLeast developed countries: UN classificationLebanonLesothoLiberiaLibyaLiechtensteinLithuaniaLow & middle incomeLow incomeLower middle incomeLuxembourgMacao SAR, ChinaMacedonia, FYRMadagascarMalawiMaldivesMaliMaltaMarshall IslandsMauritaniaMauritiusMexicoMicronesia, Fed. Sts.Middle East & North AfricaMiddle East & North Africa (excluding high income)Middle East & North Africa (IDA & IBRD countries)Middle incomeMoldovaMongoliaMontenegroMoroccoMozambiqueMyanmarNamibiaNauruNepalNetherlandsNew ZealandNicaraguaNigerNigeriaNorth AmericaNorwayOECD membersOmanOther small statesPacific island small statesPakistanPalauPanamaPapua New GuineaParaguayPeruPhilippinesPolandPortugalPost-demographic dividendPre-demographic dividendPuerto RicoQatarRomaniaRussian FederationRwandaSamoaSan MarinoSao Tome and PrincipeSaudi ArabiaSenegalSerbiaSeychellesSierra LeoneSlovak RepublicSloveniaSmall statesSolomon IslandsSouth AfricaSouth AsiaSouth Asia (IDA & IBRD)South SudanSpainSri LankaSt. Kitts and NevisSt. LuciaSt. Vincent and the GrenadinesSub-Saharan Africa Sub-Saharan Africa (excluding high income)Sub-Saharan Africa (IDA & IBRD countries)SudanSurinameSwazilandSwedenSwitzerlandSyrian Arab RepublicTajikistanTanzaniaThailandTimor-LesteTogoTongaTrinidad and TobagoTunisiaTurkeyTuvaluUgandaUkraineUnited Arab EmiratesUnited StatesUpper middle incomeUruguayUzbekistanVanuatuVenezuela, RBVietnamWest Bank and GazaWorldYemen, Rep.ZambiaZimbabwe Timeline:
This timeline shows a graph from 1974 to 2015 of Mozambique. No data until 1973. Number of actual observations by date: 31.
Source name:
World Development Indicators
Source organization:
UNESCO Institute for Statistics
Categories, topics:
Education, Gender
Last updated:
apr 23, 2017
Indicators value changes by year
Minimum:
55.339
jan 1, 1993
Maximum:
151.333
jan 1, 2011
At the date of observation
Value
Absolute change
Change from previous value
jan 1, 1974
56.487
+56.487
0.0%
jan 1, 1983
97.563
+41.076
72.72%
jan 1, 1984
82.886
-14.677
-15.04%
jan 1, 1985
90.463
+7.577
9.14%
jan 1, 1986
90.34
-0.123
-0.14%
jan 1, 1987
80.121
-10.219
-11.31%
jan 1, 1988
71.468
-8.654
-10.8%
jan 1, 1989
59.608
-11.86
-16.59%
jan 1, 1990
63.073
+3.466
5.81%
jan 1, 1991
64.343
+1.27
2.01%
jan 1, 1992
56.556
-7.787
-12.1%
jan 1, 1993
55.339
-1.218
-2.15%
jan 1, 1994
60.499
+5.16
9.32%
jan 1, 1995
62.389
+1.89
3.12%
jan 1, 1996
67.986
+5.597
8.97%
jan 1, 1999
81.365
+13.379
19.68%
jan 1, 2000
91.133
+9.768
12.0%
jan 1, 2001
99.434
+8.301
9.11%
jan 1, 2002
105.832
+6.398
6.43%
jan 1, 2003
100.702
-5.13
-4.85%
jan 1, 2005
117.052
+16.35
16.24%
jan 1, 2006
132.009
+14.957
12.78%
jan 1, 2007
131.945
-0.064
-0.05%
jan 1, 2008
144.484
+12.539
9.5%
jan 1, 2009
146.662
+2.178
1.51%
jan 1, 2010
147.169
+0.507
0.35%
jan 1, 2011
151.333
+4.165
2.83%
jan 1, 2012
147.542
-3.792
-2.51%
jan 1, 2013
148.038
+0.496
0.34%
jan 1, 2014
151.039
+3.001
2.03%
jan 1, 2015
150.975
-0.064
-0.04%
Ranking of countries by current statistics by years


Comments: