29
/
en
AIzaSyAYiBZKx7MnpbEhh9jyipgxe19OcubqV5w
April 1, 2024
227473
Qatar
QAT
true
2
1
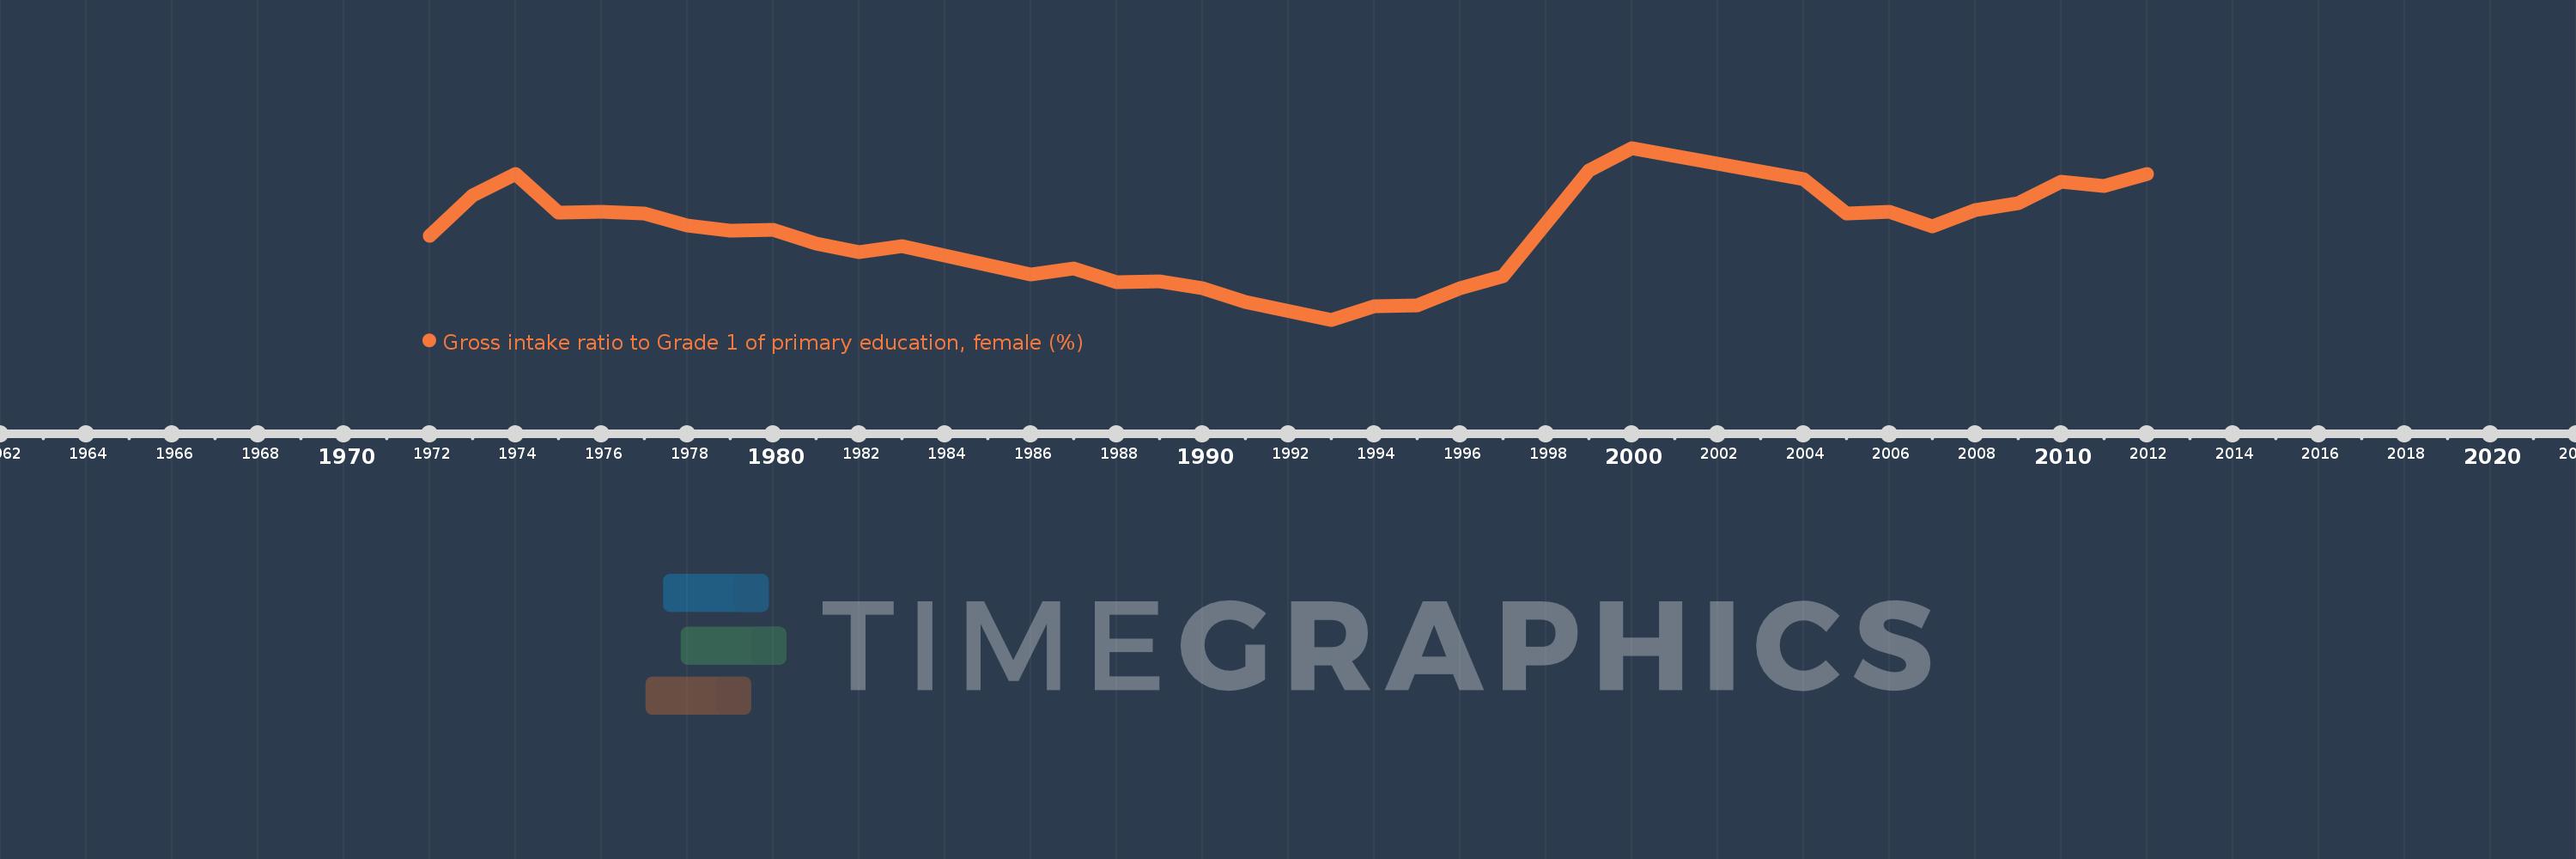
Gross intake ratio to Grade 1 of primary education, female (%)
2012,2011,2010,2009,2008,2007,2006,2005,2004,2000,1999,1997,1996,1995,1994,1993,1991,1990,1989,1988,1987,1986,1985,1983,1982,1981,1980,1979,1978,1977,1976,1975,1974,1973,1972
This statistics in other country:
AfghanistanAlbaniaAlgeriaAngolaAntigua and BarbudaArab WorldArgentinaArmeniaArubaAustriaAzerbaijanBahamas, TheBahrainBangladeshBarbadosBelarusBelgiumBelizeBeninBermudaBhutanBoliviaBosnia and HerzegovinaBotswanaBrazilBrunei DarussalamBulgariaBurkina FasoBurundiCabo VerdeCambodiaCameroonCanadaCaribbean small statesCentral African RepublicCentral Europe and the BalticsChadChileChinaColombiaComorosCongo, Dem. Rep.Congo, Rep.Costa RicaCote d'IvoireCroatiaCubaCyprusCzech RepublicDenmarkDjiboutiDominicaDominican RepublicEarly-demographic dividendEast Asia & PacificEast Asia & Pacific (excluding high income)East Asia & Pacific (IDA & IBRD countries)EcuadorEgypt, Arab Rep.El SalvadorEquatorial GuineaEritreaEstoniaEthiopiaEuro areaEurope & Central AsiaEurope & Central Asia (excluding high income)Europe & Central Asia (IDA & IBRD countries)European UnionFijiFinlandFragile and conflict affected situationsFranceGabonGambia, TheGeorgiaGermanyGhanaGreeceGrenadaGuatemalaGuineaGuinea-BissauGuyanaHaitiHeavily indebted poor countries (HIPC)High incomeHondurasHong Kong SAR, ChinaHungaryIBRD onlyIcelandIDA & IBRD totalIDA blendIDA onlyIDA totalIndiaIndonesiaIran, Islamic Rep.IraqIrelandIsraelItalyJamaicaJapanJordanKazakhstanKenyaKiribatiKorea, Dem. People’s Rep.Korea, Rep.KuwaitKyrgyz RepublicLao PDRLate-demographic dividendLatin America & Caribbean Latin America & Caribbean (excluding high income)Latin America & the Caribbean (IDA & IBRD countries)LatviaLeast developed countries: UN classificationLebanonLesothoLiberiaLibyaLiechtensteinLithuaniaLow & middle incomeLow incomeLower middle incomeLuxembourgMacao SAR, ChinaMacedonia, FYRMadagascarMalawiMaldivesMaliMaltaMarshall IslandsMauritaniaMauritiusMexicoMicronesia, Fed. Sts.Middle East & North AfricaMiddle East & North Africa (excluding high income)Middle East & North Africa (IDA & IBRD countries)Middle incomeMoldovaMongoliaMontenegroMoroccoMozambiqueMyanmarNamibiaNauruNepalNetherlandsNew ZealandNicaraguaNigerNigeriaNorth AmericaNorwayOECD membersOmanOther small statesPacific island small statesPakistanPalauPanamaPapua New GuineaParaguayPeruPhilippinesPolandPortugalPost-demographic dividendPre-demographic dividendPuerto RicoQatarRomaniaRussian FederationRwandaSamoaSan MarinoSao Tome and PrincipeSaudi ArabiaSenegalSerbiaSeychellesSierra LeoneSlovak RepublicSloveniaSmall statesSolomon IslandsSouth AfricaSouth AsiaSouth Asia (IDA & IBRD)South SudanSpainSri LankaSt. Kitts and NevisSt. LuciaSt. Vincent and the GrenadinesSub-Saharan Africa Sub-Saharan Africa (excluding high income)Sub-Saharan Africa (IDA & IBRD countries)SudanSurinameSwazilandSwedenSwitzerlandSyrian Arab RepublicTajikistanTanzaniaThailandTimor-LesteTogoTongaTrinidad and TobagoTunisiaTurkeyTuvaluUgandaUkraineUnited Arab EmiratesUnited StatesUpper middle incomeUruguayUzbekistanVanuatuVenezuela, RBVietnamWest Bank and GazaWorldYemen, Rep.ZambiaZimbabwe Timeline:
This timeline shows a graph from 1972 to 2012 of Qatar. No data until 1971. Number of actual observations by date: 35.
Source name:
World Development Indicators
Source organization:
UNESCO Institute for Statistics
Categories, topics:
Education, Gender
Last updated:
apr 23, 2017
Indicators value changes by year
Minimum:
56.311
jan 1, 1993
Maximum:
115.931
jan 1, 2000
At the date of observation
Value
Absolute change
Change from previous value
jan 1, 1972
85.55
+85.55
0.0%
jan 1, 1973
99.493
+13.944
16.3%
jan 1, 1974
106.753
+7.26
7.3%
jan 1, 1975
93.517
-13.236
-12.4%
jan 1, 1976
93.742
+0.225
0.24%
jan 1, 1977
93.142
-0.6
-0.64%
jan 1, 1978
89.097
-4.045
-4.34%
jan 1, 1979
87.241
-1.856
-2.08%
jan 1, 1980
87.47
+0.23
0.26%
jan 1, 1981
82.711
-4.759
-5.44%
jan 1, 1982
79.82
-2.892
-3.5%
jan 1, 1983
81.985
+2.165
2.71%
jan 1, 1985
75.399
-6.586
-8.03%
jan 1, 1986
72.124
-3.275
-4.34%
jan 1, 1987
73.981
+1.857
2.57%
jan 1, 1988
69.393
-4.587
-6.2%
jan 1, 1989
69.721
+0.328
0.47%
jan 1, 1990
67.211
-2.511
-3.6%
jan 1, 1991
62.423
-4.788
-7.12%
jan 1, 1993
56.311
-6.112
-9.79%
jan 1, 1994
61.08
+4.769
8.47%
jan 1, 1995
61.29
+0.21
0.34%
jan 1, 1996
67.226
+5.936
9.68%
jan 1, 1997
71.308
+4.082
6.07%
jan 1, 1999
108.139
+36.831
51.65%
jan 1, 2000
115.931
+7.792
7.21%
jan 1, 2004
104.975
-10.955
-9.45%
jan 1, 2005
93.177
-11.798
-11.24%
jan 1, 2006
93.931
+0.754
0.81%
jan 1, 2007
88.854
-5.077
-5.4%
jan 1, 2008
94.446
+5.592
6.29%
jan 1, 2009
96.726
+2.28
2.41%
jan 1, 2010
104.331
+7.605
7.86%
jan 1, 2011
102.78
-1.551
-1.49%
jan 1, 2012
106.79
+4.011
3.9%
Ranking of countries by current statistics by years


Comments: