29
/
en
AIzaSyAYiBZKx7MnpbEhh9jyipgxe19OcubqV5w
April 1, 2024
268051
Tunisia
TUN
true
2
1
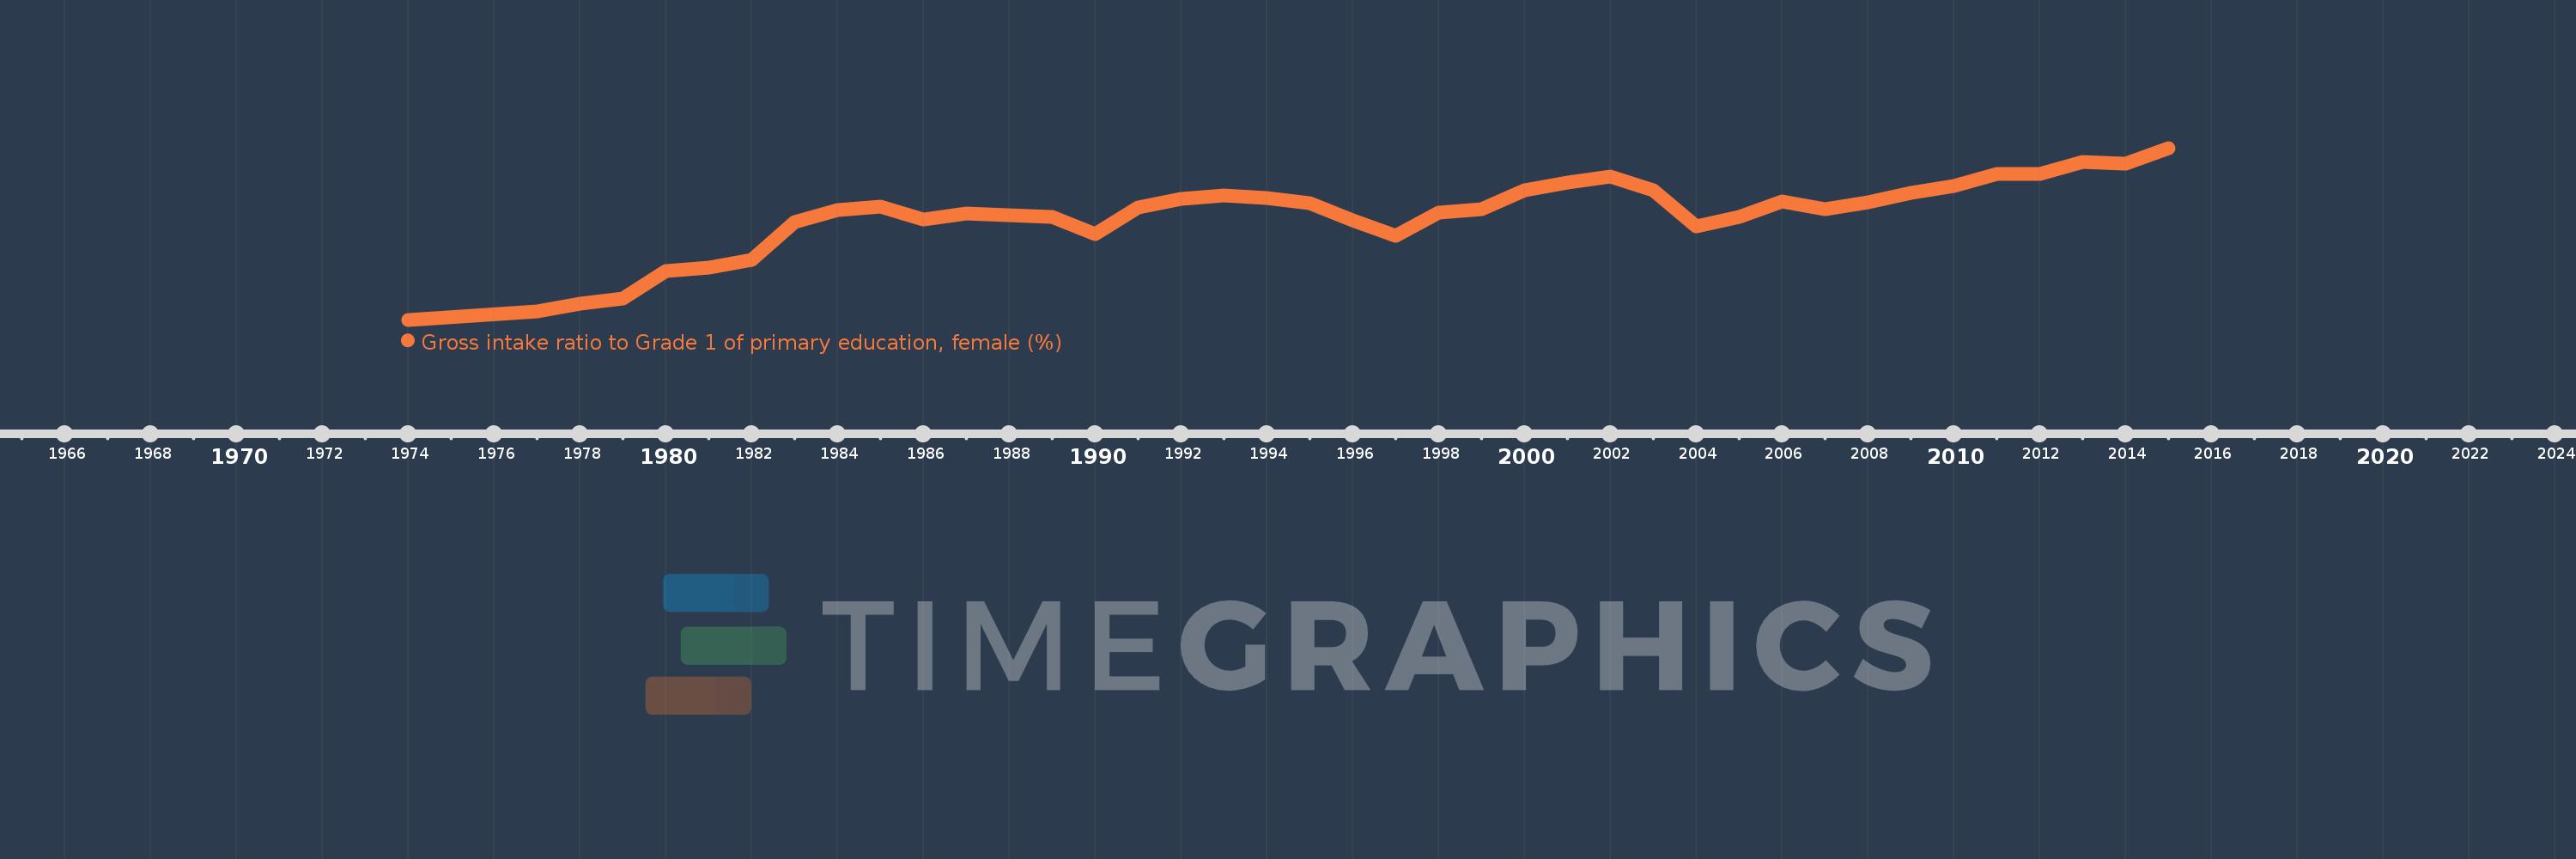
Gross intake ratio to Grade 1 of primary education, female (%)
2015,2014,2013,2012,2011,2010,2009,2008,2007,2006,2005,2004,2003,2002,2001,2000,1999,1998,1997,1996,1995,1994,1993,1992,1991,1990,1989,1987,1986,1985,1984,1983,1982,1981,1980,1979,1978,1977,1974
This statistics in other country:
AfghanistanAlbaniaAlgeriaAngolaAntigua and BarbudaArab WorldArgentinaArmeniaArubaAustriaAzerbaijanBahamas, TheBahrainBangladeshBarbadosBelarusBelgiumBelizeBeninBermudaBhutanBoliviaBosnia and HerzegovinaBotswanaBrazilBrunei DarussalamBulgariaBurkina FasoBurundiCabo VerdeCambodiaCameroonCanadaCaribbean small statesCentral African RepublicCentral Europe and the BalticsChadChileChinaColombiaComorosCongo, Dem. Rep.Congo, Rep.Costa RicaCote d'IvoireCroatiaCubaCyprusCzech RepublicDenmarkDjiboutiDominicaDominican RepublicEarly-demographic dividendEast Asia & PacificEast Asia & Pacific (excluding high income)East Asia & Pacific (IDA & IBRD countries)EcuadorEgypt, Arab Rep.El SalvadorEquatorial GuineaEritreaEstoniaEthiopiaEuro areaEurope & Central AsiaEurope & Central Asia (excluding high income)Europe & Central Asia (IDA & IBRD countries)European UnionFijiFinlandFragile and conflict affected situationsFranceGabonGambia, TheGeorgiaGermanyGhanaGreeceGrenadaGuatemalaGuineaGuinea-BissauGuyanaHaitiHeavily indebted poor countries (HIPC)High incomeHondurasHong Kong SAR, ChinaHungaryIBRD onlyIcelandIDA & IBRD totalIDA blendIDA onlyIDA totalIndiaIndonesiaIran, Islamic Rep.IraqIrelandIsraelItalyJamaicaJapanJordanKazakhstanKenyaKiribatiKorea, Dem. People’s Rep.Korea, Rep.KuwaitKyrgyz RepublicLao PDRLate-demographic dividendLatin America & Caribbean Latin America & Caribbean (excluding high income)Latin America & the Caribbean (IDA & IBRD countries)LatviaLeast developed countries: UN classificationLebanonLesothoLiberiaLibyaLiechtensteinLithuaniaLow & middle incomeLow incomeLower middle incomeLuxembourgMacao SAR, ChinaMacedonia, FYRMadagascarMalawiMaldivesMaliMaltaMarshall IslandsMauritaniaMauritiusMexicoMicronesia, Fed. Sts.Middle East & North AfricaMiddle East & North Africa (excluding high income)Middle East & North Africa (IDA & IBRD countries)Middle incomeMoldovaMongoliaMontenegroMoroccoMozambiqueMyanmarNamibiaNauruNepalNetherlandsNew ZealandNicaraguaNigerNigeriaNorth AmericaNorwayOECD membersOmanOther small statesPacific island small statesPakistanPalauPanamaPapua New GuineaParaguayPeruPhilippinesPolandPortugalPost-demographic dividendPre-demographic dividendPuerto RicoQatarRomaniaRussian FederationRwandaSamoaSan MarinoSao Tome and PrincipeSaudi ArabiaSenegalSerbiaSeychellesSierra LeoneSlovak RepublicSloveniaSmall statesSolomon IslandsSouth AfricaSouth AsiaSouth Asia (IDA & IBRD)South SudanSpainSri LankaSt. Kitts and NevisSt. LuciaSt. Vincent and the GrenadinesSub-Saharan Africa Sub-Saharan Africa (excluding high income)Sub-Saharan Africa (IDA & IBRD countries)SudanSurinameSwazilandSwedenSwitzerlandSyrian Arab RepublicTajikistanTanzaniaThailandTimor-LesteTogoTongaTrinidad and TobagoTunisiaTurkeyTuvaluUgandaUkraineUnited Arab EmiratesUnited StatesUpper middle incomeUruguayUzbekistanVanuatuVenezuela, RBVietnamWest Bank and GazaWorldYemen, Rep.ZambiaZimbabwe Timeline:
This timeline shows a graph from 1974 to 2015 of Tunisia. No data until 1973. Number of actual observations by date: 39.
Source name:
World Development Indicators
Source organization:
UNESCO Institute for Statistics
Categories, topics:
Education, Gender
Last updated:
apr 23, 2017
Indicators value changes by year
Minimum:
71.325
jan 1, 1974
At the date of observation
Value
Absolute change
Change from previous value
jan 1, 1974
71.325
+71.325
0.0%
jan 1, 1977
73.392
+2.067
2.9%
jan 1, 1978
75.145
+1.753
2.39%
jan 1, 1979
76.332
+1.187
1.58%
jan 1, 1980
82.987
+6.655
8.72%
jan 1, 1981
83.758
+0.771
0.93%
jan 1, 1982
85.718
+1.96
2.34%
jan 1, 1983
94.65
+8.933
10.42%
jan 1, 1984
97.623
+2.973
3.14%
jan 1, 1985
98.334
+0.711
0.73%
jan 1, 1986
95.387
-2.947
-3.0%
jan 1, 1987
96.765
+1.378
1.44%
jan 1, 1989
95.891
-0.874
-0.9%
jan 1, 1990
91.826
-4.066
-4.24%
jan 1, 1991
98.229
+6.403
6.97%
jan 1, 1992
100.232
+2.003
2.04%
jan 1, 1993
101.111
+0.88
0.88%
jan 1, 1994
100.435
-0.676
-0.67%
jan 1, 1995
99.131
-1.305
-1.3%
jan 1, 1996
95.054
-4.077
-4.11%
jan 1, 1997
91.41
-3.644
-3.83%
jan 1, 1998
96.87
+5.46
5.97%
jan 1, 1999
97.819
+0.949
0.98%
jan 1, 2000
102.244
+4.425
4.52%
jan 1, 2001
104.055
+1.811
1.77%
jan 1, 2002
105.582
+1.528
1.47%
jan 1, 2003
102.354
-3.229
-3.06%
jan 1, 2004
93.673
-8.681
-8.48%
jan 1, 2005
95.989
+2.317
2.47%
jan 1, 2006
99.654
+3.665
3.82%
jan 1, 2007
97.798
-1.856
-1.86%
jan 1, 2008
99.439
+1.641
1.68%
jan 1, 2009
101.713
+2.273
2.29%
jan 1, 2010
103.309
+1.596
1.57%
jan 1, 2011
106.207
+2.898
2.81%
jan 1, 2012
106.219
+0.011
0.01%
jan 1, 2013
109.129
+2.911
2.74%
jan 1, 2014
108.574
-0.555
-0.51%
jan 1, 2015
112.4
+3.825
3.52%
Ranking of countries by current statistics by years


Comments: