29
/
en
AIzaSyAYiBZKx7MnpbEhh9jyipgxe19OcubqV5w
April 1, 2024
168672
Kiribati
KIR
true
2
1
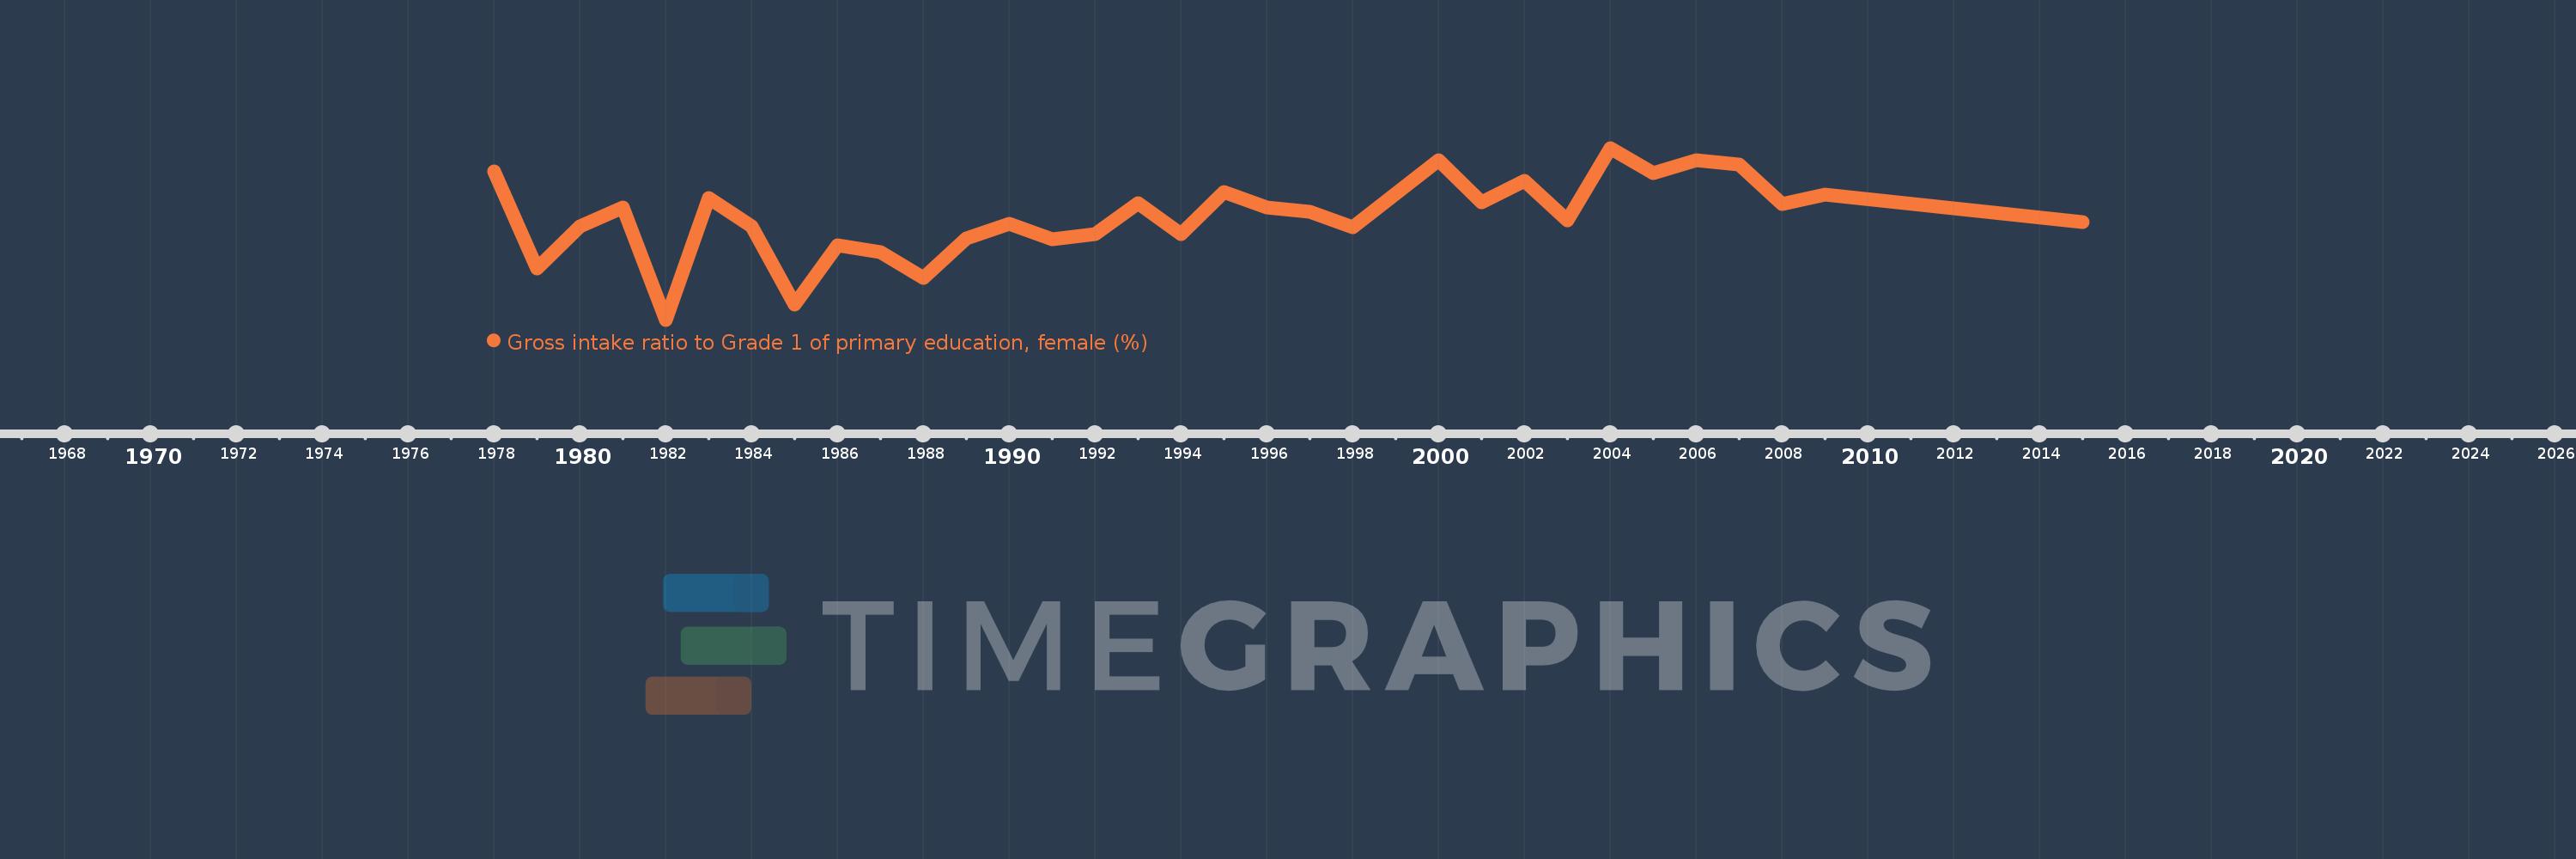
Gross intake ratio to Grade 1 of primary education, female (%)
2015,2009,2008,2007,2006,2005,2004,2003,2002,2001,2000,1998,1997,1996,1995,1994,1993,1992,1991,1990,1989,1988,1987,1986,1985,1984,1983,1982,1981,1980,1979,1978
This statistics in other country:
AfghanistanAlbaniaAlgeriaAngolaAntigua and BarbudaArab WorldArgentinaArmeniaArubaAustriaAzerbaijanBahamas, TheBahrainBangladeshBarbadosBelarusBelgiumBelizeBeninBermudaBhutanBoliviaBosnia and HerzegovinaBotswanaBrazilBrunei DarussalamBulgariaBurkina FasoBurundiCabo VerdeCambodiaCameroonCanadaCaribbean small statesCentral African RepublicCentral Europe and the BalticsChadChileChinaColombiaComorosCongo, Dem. Rep.Congo, Rep.Costa RicaCote d'IvoireCroatiaCubaCyprusCzech RepublicDenmarkDjiboutiDominicaDominican RepublicEarly-demographic dividendEast Asia & PacificEast Asia & Pacific (excluding high income)East Asia & Pacific (IDA & IBRD countries)EcuadorEgypt, Arab Rep.El SalvadorEquatorial GuineaEritreaEstoniaEthiopiaEuro areaEurope & Central AsiaEurope & Central Asia (excluding high income)Europe & Central Asia (IDA & IBRD countries)European UnionFijiFinlandFragile and conflict affected situationsFranceGabonGambia, TheGeorgiaGermanyGhanaGreeceGrenadaGuatemalaGuineaGuinea-BissauGuyanaHaitiHeavily indebted poor countries (HIPC)High incomeHondurasHong Kong SAR, ChinaHungaryIBRD onlyIcelandIDA & IBRD totalIDA blendIDA onlyIDA totalIndiaIndonesiaIran, Islamic Rep.IraqIrelandIsraelItalyJamaicaJapanJordanKazakhstanKenyaKiribatiKorea, Dem. People’s Rep.Korea, Rep.KuwaitKyrgyz RepublicLao PDRLate-demographic dividendLatin America & Caribbean Latin America & Caribbean (excluding high income)Latin America & the Caribbean (IDA & IBRD countries)LatviaLeast developed countries: UN classificationLebanonLesothoLiberiaLibyaLiechtensteinLithuaniaLow & middle incomeLow incomeLower middle incomeLuxembourgMacao SAR, ChinaMacedonia, FYRMadagascarMalawiMaldivesMaliMaltaMarshall IslandsMauritaniaMauritiusMexicoMicronesia, Fed. Sts.Middle East & North AfricaMiddle East & North Africa (excluding high income)Middle East & North Africa (IDA & IBRD countries)Middle incomeMoldovaMongoliaMontenegroMoroccoMozambiqueMyanmarNamibiaNauruNepalNetherlandsNew ZealandNicaraguaNigerNigeriaNorth AmericaNorwayOECD membersOmanOther small statesPacific island small statesPakistanPalauPanamaPapua New GuineaParaguayPeruPhilippinesPolandPortugalPost-demographic dividendPre-demographic dividendPuerto RicoQatarRomaniaRussian FederationRwandaSamoaSan MarinoSao Tome and PrincipeSaudi ArabiaSenegalSerbiaSeychellesSierra LeoneSlovak RepublicSloveniaSmall statesSolomon IslandsSouth AfricaSouth AsiaSouth Asia (IDA & IBRD)South SudanSpainSri LankaSt. Kitts and NevisSt. LuciaSt. Vincent and the GrenadinesSub-Saharan Africa Sub-Saharan Africa (excluding high income)Sub-Saharan Africa (IDA & IBRD countries)SudanSurinameSwazilandSwedenSwitzerlandSyrian Arab RepublicTajikistanTanzaniaThailandTimor-LesteTogoTongaTrinidad and TobagoTunisiaTurkeyTuvaluUgandaUkraineUnited Arab EmiratesUnited StatesUpper middle incomeUruguayUzbekistanVanuatuVenezuela, RBVietnamWest Bank and GazaWorldYemen, Rep.ZambiaZimbabwe Timeline:
This timeline shows a graph from 1978 to 2015 of Kiribati. No data until 1977. Number of actual observations by date: 32.
Source name:
World Development Indicators
Source organization:
UNESCO Institute for Statistics
Categories, topics:
Education, Gender
Last updated:
apr 23, 2017
Indicators value changes by year
Minimum:
84.034
jan 1, 1982
Maximum:
125.315
jan 1, 2004
At the date of observation
Value
Absolute change
Change from previous value
jan 1, 1978
119.64
+119.64
0.0%
jan 1, 1979
96.343
-23.297
-19.47%
jan 1, 1980
106.41
+10.067
10.45%
jan 1, 1981
110.969
+4.558
4.28%
jan 1, 1982
84.034
-26.935
-24.27%
jan 1, 1983
113.342
+29.309
34.88%
jan 1, 1984
106.394
-6.948
-6.13%
jan 1, 1985
87.621
-18.772
-17.64%
jan 1, 1986
101.97
+14.349
16.38%
jan 1, 1987
100.337
-1.633
-1.6%
jan 1, 1988
93.996
-6.341
-6.32%
jan 1, 1989
103.511
+9.515
10.12%
jan 1, 1990
107.15
+3.64
3.52%
jan 1, 1991
103.427
-3.723
-3.47%
jan 1, 1992
104.51
+1.082
1.05%
jan 1, 1993
112.008
+7.498
7.17%
jan 1, 1994
104.537
-7.471
-6.67%
jan 1, 1995
114.7
+10.164
9.72%
jan 1, 1996
111.049
-3.651
-3.18%
jan 1, 1997
109.954
-1.095
-0.99%
jan 1, 1998
106.164
-3.79
-3.45%
jan 1, 2000
122.304
+16.14
15.2%
jan 1, 2001
112.305
-9.999
-8.18%
jan 1, 2002
117.407
+5.102
4.54%
jan 1, 2003
107.982
-9.425
-8.03%
jan 1, 2004
125.315
+17.333
16.05%
jan 1, 2005
119.175
-6.141
-4.9%
jan 1, 2006
122.275
+3.1
2.6%
jan 1, 2007
121.394
-0.881
-0.72%
jan 1, 2008
111.909
-9.485
-7.81%
jan 1, 2009
114.208
+2.299
2.05%
jan 1, 2015
107.465
-6.743
-5.9%
Ranking of countries by current statistics by years


Comments: