29
/
en
AIzaSyAYiBZKx7MnpbEhh9jyipgxe19OcubqV5w
April 1, 2024
113653
Cote d'Ivoire
CIV
true
2
1
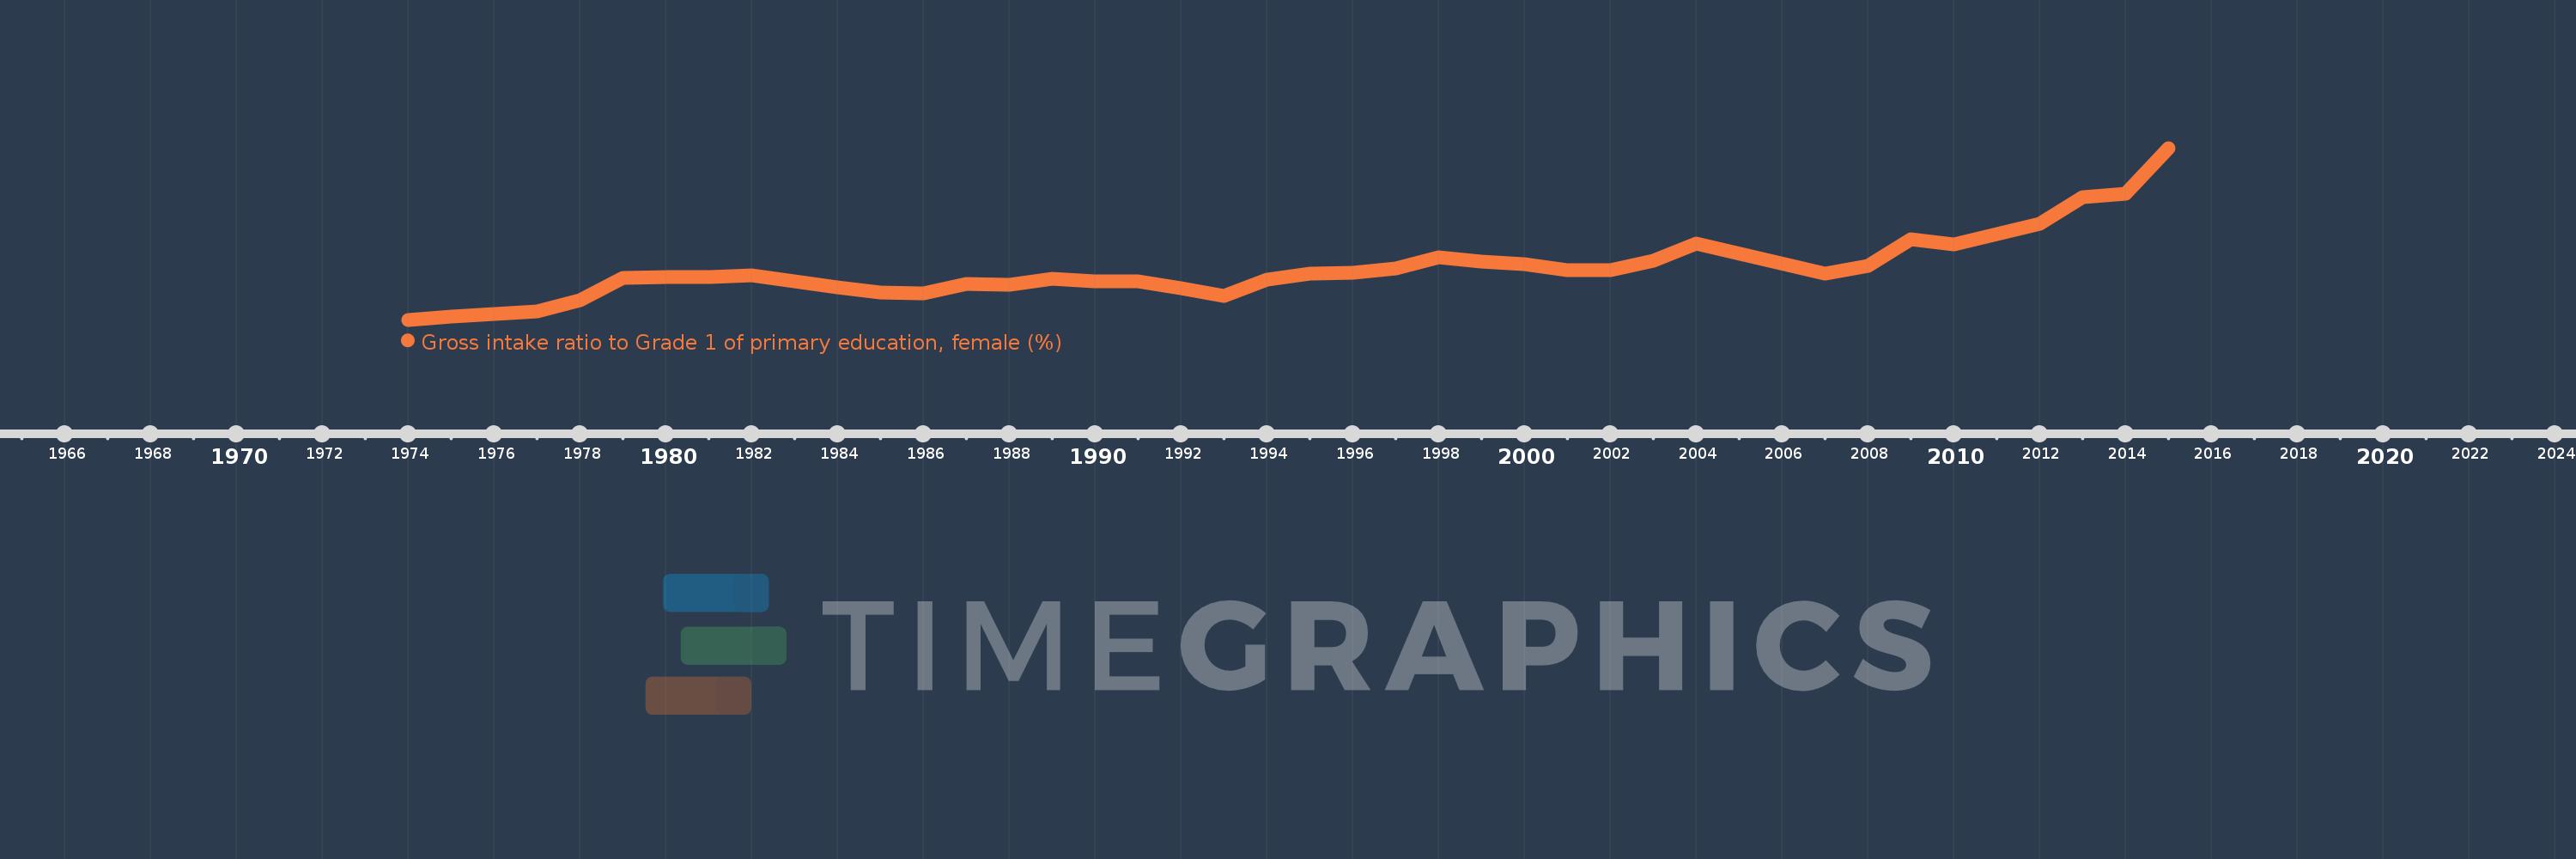
Gross intake ratio to Grade 1 of primary education, female (%)
2015,2014,2013,2012,2010,2009,2008,2007,2004,2003,2002,2001,2000,1999,1998,1997,1996,1995,1994,1993,1992,1991,1990,1989,1988,1987,1986,1985,1984,1982,1981,1980,1979,1978,1977,1975,1974
This statistics in other country:
AfghanistanAlbaniaAlgeriaAngolaAntigua and BarbudaArab WorldArgentinaArmeniaArubaAustriaAzerbaijanBahamas, TheBahrainBangladeshBarbadosBelarusBelgiumBelizeBeninBermudaBhutanBoliviaBosnia and HerzegovinaBotswanaBrazilBrunei DarussalamBulgariaBurkina FasoBurundiCabo VerdeCambodiaCameroonCanadaCaribbean small statesCentral African RepublicCentral Europe and the BalticsChadChileChinaColombiaComorosCongo, Dem. Rep.Congo, Rep.Costa RicaCote d'IvoireCroatiaCubaCyprusCzech RepublicDenmarkDjiboutiDominicaDominican RepublicEarly-demographic dividendEast Asia & PacificEast Asia & Pacific (excluding high income)East Asia & Pacific (IDA & IBRD countries)EcuadorEgypt, Arab Rep.El SalvadorEquatorial GuineaEritreaEstoniaEthiopiaEuro areaEurope & Central AsiaEurope & Central Asia (excluding high income)Europe & Central Asia (IDA & IBRD countries)European UnionFijiFinlandFragile and conflict affected situationsFranceGabonGambia, TheGeorgiaGermanyGhanaGreeceGrenadaGuatemalaGuineaGuinea-BissauGuyanaHaitiHeavily indebted poor countries (HIPC)High incomeHondurasHong Kong SAR, ChinaHungaryIBRD onlyIcelandIDA & IBRD totalIDA blendIDA onlyIDA totalIndiaIndonesiaIran, Islamic Rep.IraqIrelandIsraelItalyJamaicaJapanJordanKazakhstanKenyaKiribatiKorea, Dem. People’s Rep.Korea, Rep.KuwaitKyrgyz RepublicLao PDRLate-demographic dividendLatin America & Caribbean Latin America & Caribbean (excluding high income)Latin America & the Caribbean (IDA & IBRD countries)LatviaLeast developed countries: UN classificationLebanonLesothoLiberiaLibyaLiechtensteinLithuaniaLow & middle incomeLow incomeLower middle incomeLuxembourgMacao SAR, ChinaMacedonia, FYRMadagascarMalawiMaldivesMaliMaltaMarshall IslandsMauritaniaMauritiusMexicoMicronesia, Fed. Sts.Middle East & North AfricaMiddle East & North Africa (excluding high income)Middle East & North Africa (IDA & IBRD countries)Middle incomeMoldovaMongoliaMontenegroMoroccoMozambiqueMyanmarNamibiaNauruNepalNetherlandsNew ZealandNicaraguaNigerNigeriaNorth AmericaNorwayOECD membersOmanOther small statesPacific island small statesPakistanPalauPanamaPapua New GuineaParaguayPeruPhilippinesPolandPortugalPost-demographic dividendPre-demographic dividendPuerto RicoQatarRomaniaRussian FederationRwandaSamoaSan MarinoSao Tome and PrincipeSaudi ArabiaSenegalSerbiaSeychellesSierra LeoneSlovak RepublicSloveniaSmall statesSolomon IslandsSouth AfricaSouth AsiaSouth Asia (IDA & IBRD)South SudanSpainSri LankaSt. Kitts and NevisSt. LuciaSt. Vincent and the GrenadinesSub-Saharan Africa Sub-Saharan Africa (excluding high income)Sub-Saharan Africa (IDA & IBRD countries)SudanSurinameSwazilandSwedenSwitzerlandSyrian Arab RepublicTajikistanTanzaniaThailandTimor-LesteTogoTongaTrinidad and TobagoTunisiaTurkeyTuvaluUgandaUkraineUnited Arab EmiratesUnited StatesUpper middle incomeUruguayUzbekistanVanuatuVenezuela, RBVietnamWest Bank and GazaWorldYemen, Rep.ZambiaZimbabwe Timeline:
This timeline shows a graph from 1974 to 2015 of Cote d'Ivoire. No data until 1973. Number of actual observations by date: 37.
Source name:
World Development Indicators
Source organization:
UNESCO Institute for Statistics
Categories, topics:
Education, Gender
Last updated:
apr 23, 2017
Indicators value changes by year
Minimum:
42.647
jan 1, 1974
Maximum:
94.742
jan 1, 2015
At the date of observation
Value
Absolute change
Change from previous value
jan 1, 1974
42.647
+42.647
0.0%
jan 1, 1975
43.511
+0.865
2.03%
jan 1, 1977
45.301
+1.789
4.11%
jan 1, 1978
48.473
+3.173
7.0%
jan 1, 1979
55.358
+6.884
14.2%
jan 1, 1980
55.521
+0.163
0.3%
jan 1, 1981
55.551
+0.03
0.05%
jan 1, 1982
56.089
+0.538
0.97%
jan 1, 1984
52.43
-3.659
-6.52%
jan 1, 1985
51.032
-1.398
-2.67%
jan 1, 1986
50.689
-0.343
-0.67%
jan 1, 1987
53.615
+2.926
5.77%
jan 1, 1988
53.28
-0.335
-0.63%
jan 1, 1989
55.186
+1.907
3.58%
jan 1, 1990
54.203
-0.983
-1.78%
jan 1, 1991
54.3
+0.097
0.18%
jan 1, 1992
52.258
-2.042
-3.76%
jan 1, 1993
49.838
-2.421
-4.63%
jan 1, 1994
54.818
+4.981
9.99%
jan 1, 1995
56.619
+1.801
3.29%
jan 1, 1996
56.865
+0.246
0.43%
jan 1, 1997
58.308
+1.442
2.54%
jan 1, 1998
61.589
+3.281
5.63%
jan 1, 1999
60.337
-1.251
-2.03%
jan 1, 2000
59.455
-0.882
-1.46%
jan 1, 2001
57.729
-1.726
-2.9%
jan 1, 2002
57.711
-0.018
-0.03%
jan 1, 2003
60.666
+2.955
5.12%
jan 1, 2004
65.651
+4.985
8.22%
jan 1, 2007
56.607
-9.044
-13.78%
jan 1, 2008
58.867
+2.261
3.99%
jan 1, 2009
67.082
+8.214
13.95%
jan 1, 2010
65.553
-1.529
-2.28%
jan 1, 2012
71.741
+6.188
9.44%
jan 1, 2013
79.742
+8.001
11.15%
jan 1, 2014
80.741
+0.999
1.25%
jan 1, 2015
94.742
+14.0
17.34%
Ranking of countries by current statistics by years


Comments: