29
/
en
AIzaSyAYiBZKx7MnpbEhh9jyipgxe19OcubqV5w
April 1, 2024
112315
Costa Rica
CRI
true
2
1
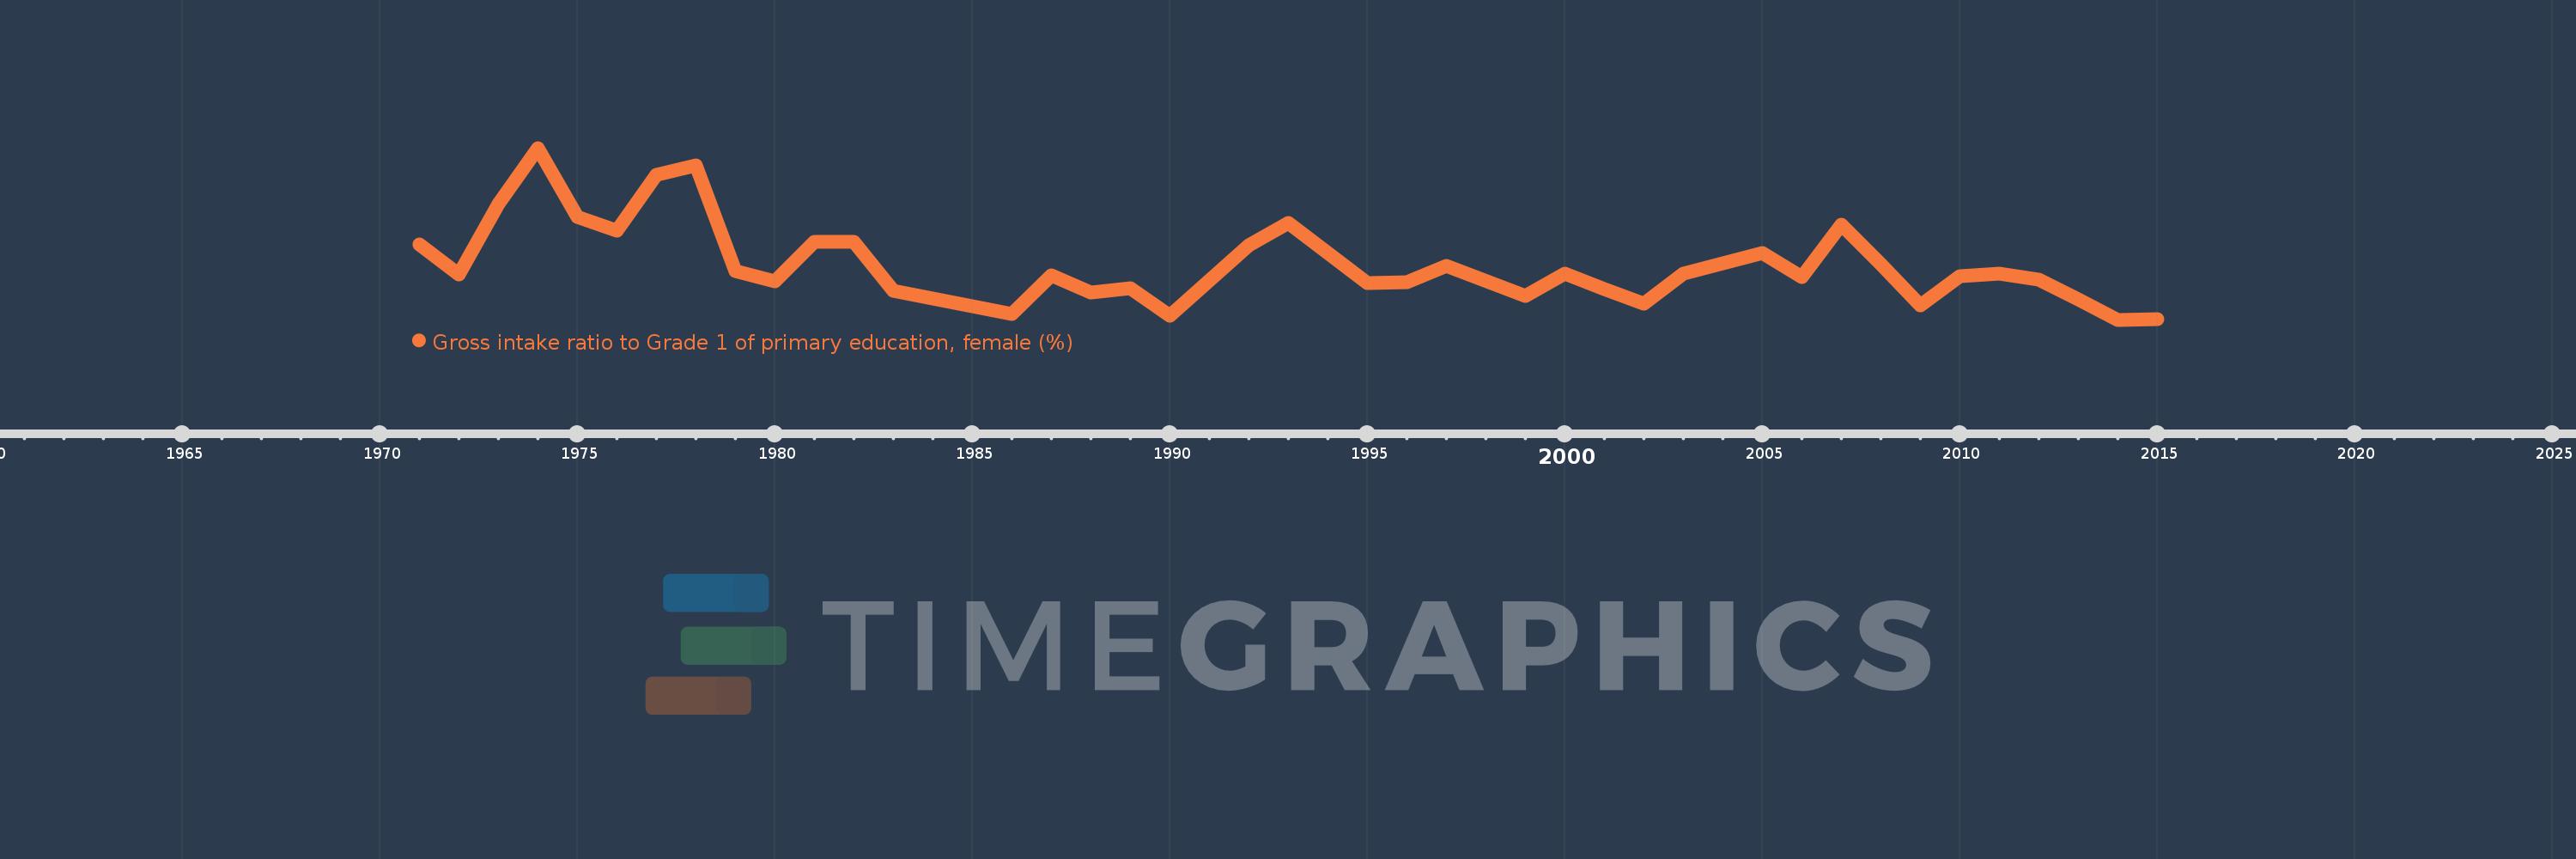
Gross intake ratio to Grade 1 of primary education, female (%)
2015,2014,2013,2012,2011,2010,2009,2008,2007,2006,2005,2003,2002,2001,2000,1999,1997,1996,1995,1994,1993,1992,1990,1989,1988,1987,1986,1983,1982,1981,1980,1979,1978,1977,1976,1975,1974,1973,1972,1971
This statistics in other country:
AfghanistanAlbaniaAlgeriaAngolaAntigua and BarbudaArab WorldArgentinaArmeniaArubaAustriaAzerbaijanBahamas, TheBahrainBangladeshBarbadosBelarusBelgiumBelizeBeninBermudaBhutanBoliviaBosnia and HerzegovinaBotswanaBrazilBrunei DarussalamBulgariaBurkina FasoBurundiCabo VerdeCambodiaCameroonCanadaCaribbean small statesCentral African RepublicCentral Europe and the BalticsChadChileChinaColombiaComorosCongo, Dem. Rep.Congo, Rep.Costa RicaCote d'IvoireCroatiaCubaCyprusCzech RepublicDenmarkDjiboutiDominicaDominican RepublicEarly-demographic dividendEast Asia & PacificEast Asia & Pacific (excluding high income)East Asia & Pacific (IDA & IBRD countries)EcuadorEgypt, Arab Rep.El SalvadorEquatorial GuineaEritreaEstoniaEthiopiaEuro areaEurope & Central AsiaEurope & Central Asia (excluding high income)Europe & Central Asia (IDA & IBRD countries)European UnionFijiFinlandFragile and conflict affected situationsFranceGabonGambia, TheGeorgiaGermanyGhanaGreeceGrenadaGuatemalaGuineaGuinea-BissauGuyanaHaitiHeavily indebted poor countries (HIPC)High incomeHondurasHong Kong SAR, ChinaHungaryIBRD onlyIcelandIDA & IBRD totalIDA blendIDA onlyIDA totalIndiaIndonesiaIran, Islamic Rep.IraqIrelandIsraelItalyJamaicaJapanJordanKazakhstanKenyaKiribatiKorea, Dem. People’s Rep.Korea, Rep.KuwaitKyrgyz RepublicLao PDRLate-demographic dividendLatin America & Caribbean Latin America & Caribbean (excluding high income)Latin America & the Caribbean (IDA & IBRD countries)LatviaLeast developed countries: UN classificationLebanonLesothoLiberiaLibyaLiechtensteinLithuaniaLow & middle incomeLow incomeLower middle incomeLuxembourgMacao SAR, ChinaMacedonia, FYRMadagascarMalawiMaldivesMaliMaltaMarshall IslandsMauritaniaMauritiusMexicoMicronesia, Fed. Sts.Middle East & North AfricaMiddle East & North Africa (excluding high income)Middle East & North Africa (IDA & IBRD countries)Middle incomeMoldovaMongoliaMontenegroMoroccoMozambiqueMyanmarNamibiaNauruNepalNetherlandsNew ZealandNicaraguaNigerNigeriaNorth AmericaNorwayOECD membersOmanOther small statesPacific island small statesPakistanPalauPanamaPapua New GuineaParaguayPeruPhilippinesPolandPortugalPost-demographic dividendPre-demographic dividendPuerto RicoQatarRomaniaRussian FederationRwandaSamoaSan MarinoSao Tome and PrincipeSaudi ArabiaSenegalSerbiaSeychellesSierra LeoneSlovak RepublicSloveniaSmall statesSolomon IslandsSouth AfricaSouth AsiaSouth Asia (IDA & IBRD)South SudanSpainSri LankaSt. Kitts and NevisSt. LuciaSt. Vincent and the GrenadinesSub-Saharan Africa Sub-Saharan Africa (excluding high income)Sub-Saharan Africa (IDA & IBRD countries)SudanSurinameSwazilandSwedenSwitzerlandSyrian Arab RepublicTajikistanTanzaniaThailandTimor-LesteTogoTongaTrinidad and TobagoTunisiaTurkeyTuvaluUgandaUkraineUnited Arab EmiratesUnited StatesUpper middle incomeUruguayUzbekistanVanuatuVenezuela, RBVietnamWest Bank and GazaWorldYemen, Rep.ZambiaZimbabwe Timeline:
This timeline shows a graph from 1971 to 2015 of Costa Rica. No data until 1970. Number of actual observations by date: 40.
Source name:
World Development Indicators
Source organization:
UNESCO Institute for Statistics
Categories, topics:
Education, Gender
Last updated:
apr 23, 2017
Indicators value changes by year
Minimum:
100.72
jan 1, 2014
Maximum:
121.229
jan 1, 1974
At the date of observation
Value
Absolute change
Change from previous value
jan 1, 1971
109.715
+109.715
0.0%
jan 1, 1972
106.131
-3.584
-3.27%
jan 1, 1973
114.519
+8.388
7.9%
jan 1, 1974
121.229
+6.71
5.86%
jan 1, 1975
112.993
-8.236
-6.79%
jan 1, 1976
111.326
-1.667
-1.48%
jan 1, 1977
118.058
+6.732
6.05%
jan 1, 1978
119.129
+1.071
0.91%
jan 1, 1979
106.558
-12.57
-10.55%
jan 1, 1980
105.277
-1.281
-1.2%
jan 1, 1981
110.048
+4.771
4.53%
jan 1, 1982
110.021
-0.027
-0.02%
jan 1, 1983
104.187
-5.834
-5.3%
jan 1, 1986
101.394
-2.793
-2.68%
jan 1, 1987
106.002
+4.608
4.55%
jan 1, 1988
103.963
-2.039
-1.92%
jan 1, 1989
104.439
+0.476
0.46%
jan 1, 1990
101.2
-3.24
-3.1%
jan 1, 1992
109.611
+8.411
8.31%
jan 1, 1993
112.287
+2.676
2.44%
jan 1, 1994
108.637
-3.65
-3.25%
jan 1, 1995
105.062
-3.575
-3.29%
jan 1, 1996
105.17
+0.108
0.1%
jan 1, 1997
107.141
+1.971
1.87%
jan 1, 1999
103.55
-3.591
-3.35%
jan 1, 2000
106.237
+2.687
2.6%
jan 1, 2001
104.432
-1.805
-1.7%
jan 1, 2002
102.609
-1.823
-1.75%
jan 1, 2003
106.249
+3.639
3.55%
jan 1, 2005
108.638
+2.39
2.25%
jan 1, 2006
105.77
-2.868
-2.64%
jan 1, 2007
112.033
+6.263
5.92%
jan 1, 2008
107.39
-4.643
-4.14%
jan 1, 2009
102.415
-4.975
-4.63%
jan 1, 2010
105.962
+3.547
3.46%
jan 1, 2011
106.249
+0.287
0.27%
jan 1, 2012
105.488
-0.761
-0.72%
jan 1, 2013
103.139
-2.35
-2.23%
jan 1, 2014
100.72
-2.419
-2.35%
jan 1, 2015
100.796
+0.076
0.08%
Ranking of countries by current statistics by years


Comments: