29
/
en
AIzaSyAYiBZKx7MnpbEhh9jyipgxe19OcubqV5w
April 1, 2024
123559
Ecuador
ECU
true
2
1
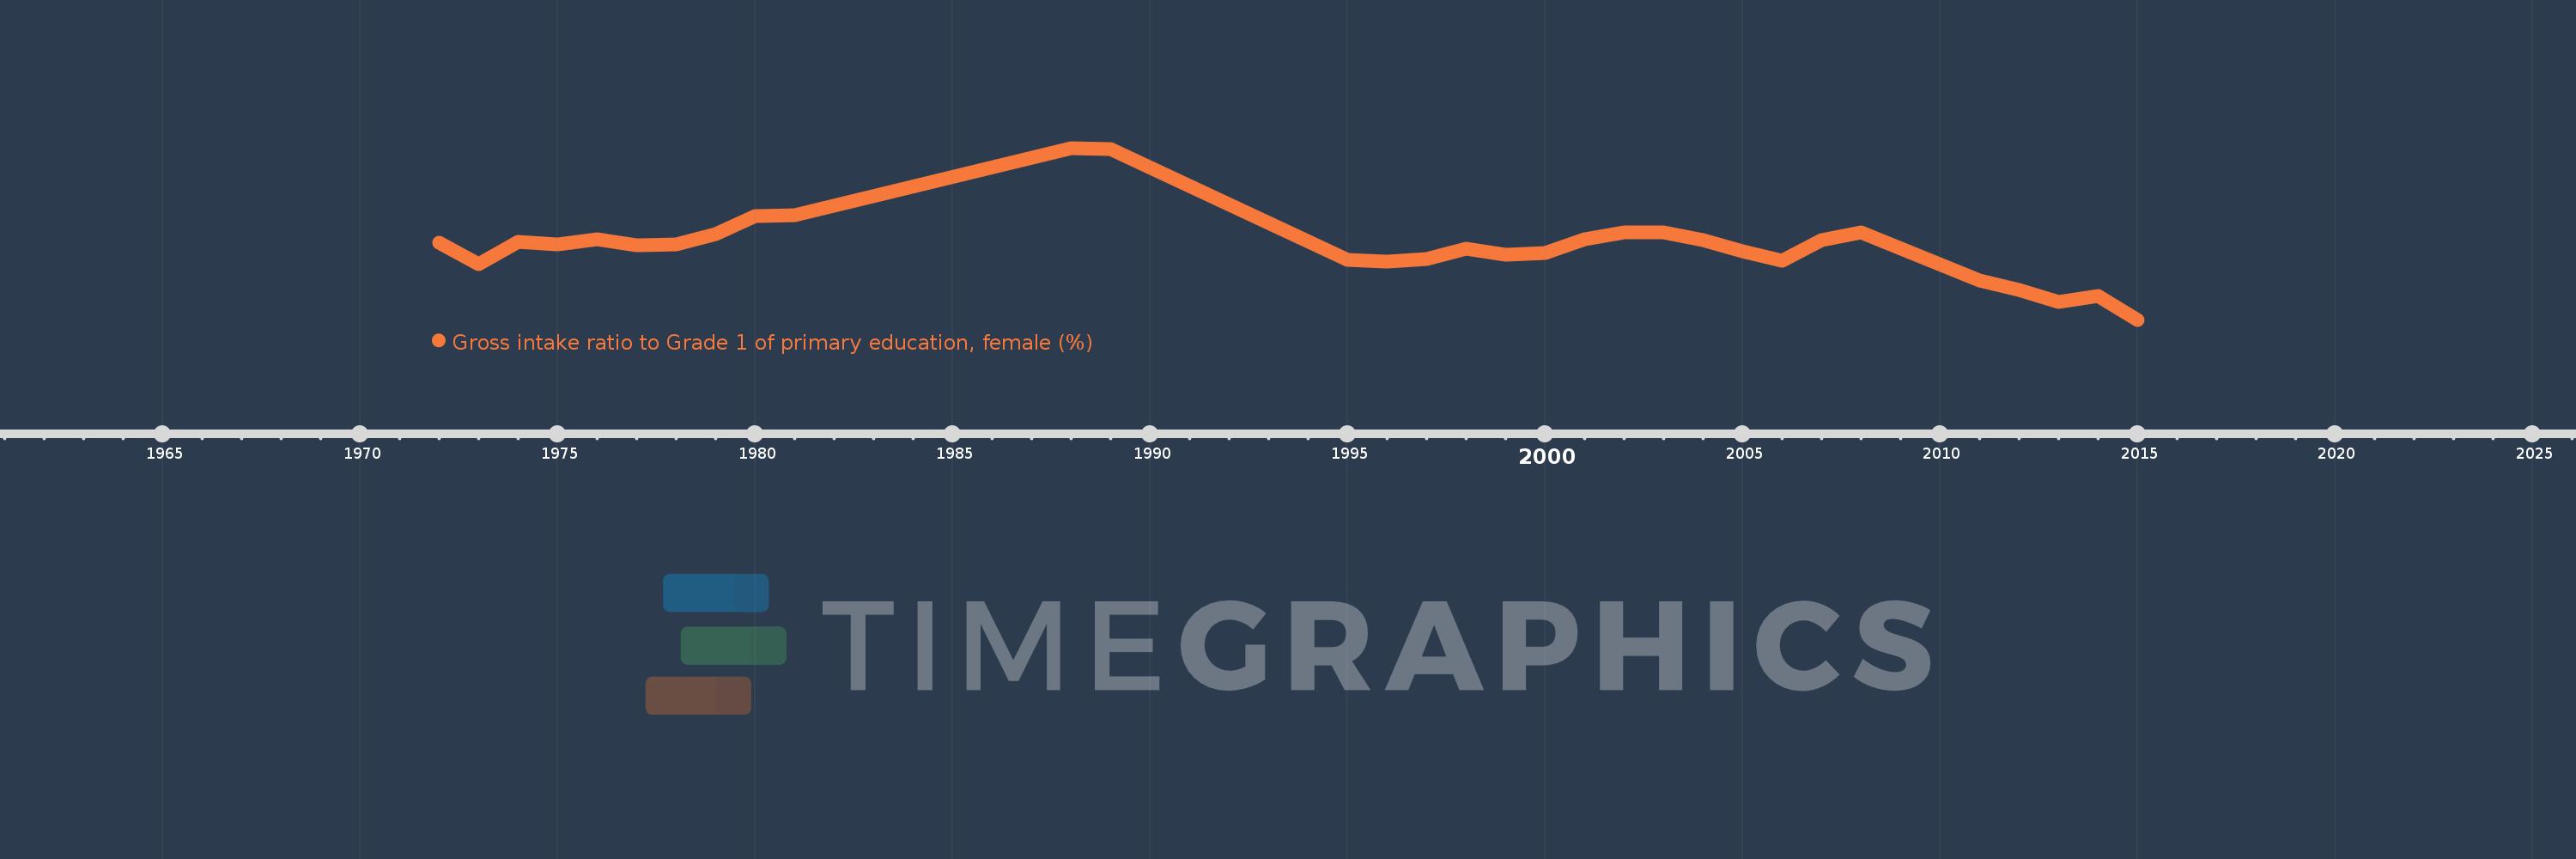
Gross intake ratio to Grade 1 of primary education, female (%)
2015,2014,2013,2012,2011,2008,2007,2006,2005,2004,2003,2002,2001,2000,1999,1998,1997,1996,1995,1989,1988,1981,1980,1979,1978,1977,1976,1975,1974,1973,1972
This statistics in other country:
AfghanistanAlbaniaAlgeriaAngolaAntigua and BarbudaArab WorldArgentinaArmeniaArubaAustriaAzerbaijanBahamas, TheBahrainBangladeshBarbadosBelarusBelgiumBelizeBeninBermudaBhutanBoliviaBosnia and HerzegovinaBotswanaBrazilBrunei DarussalamBulgariaBurkina FasoBurundiCabo VerdeCambodiaCameroonCanadaCaribbean small statesCentral African RepublicCentral Europe and the BalticsChadChileChinaColombiaComorosCongo, Dem. Rep.Congo, Rep.Costa RicaCote d'IvoireCroatiaCubaCyprusCzech RepublicDenmarkDjiboutiDominicaDominican RepublicEarly-demographic dividendEast Asia & PacificEast Asia & Pacific (excluding high income)East Asia & Pacific (IDA & IBRD countries)EcuadorEgypt, Arab Rep.El SalvadorEquatorial GuineaEritreaEstoniaEthiopiaEuro areaEurope & Central AsiaEurope & Central Asia (excluding high income)Europe & Central Asia (IDA & IBRD countries)European UnionFijiFinlandFragile and conflict affected situationsFranceGabonGambia, TheGeorgiaGermanyGhanaGreeceGrenadaGuatemalaGuineaGuinea-BissauGuyanaHaitiHeavily indebted poor countries (HIPC)High incomeHondurasHong Kong SAR, ChinaHungaryIBRD onlyIcelandIDA & IBRD totalIDA blendIDA onlyIDA totalIndiaIndonesiaIran, Islamic Rep.IraqIrelandIsraelItalyJamaicaJapanJordanKazakhstanKenyaKiribatiKorea, Dem. People’s Rep.Korea, Rep.KuwaitKyrgyz RepublicLao PDRLate-demographic dividendLatin America & Caribbean Latin America & Caribbean (excluding high income)Latin America & the Caribbean (IDA & IBRD countries)LatviaLeast developed countries: UN classificationLebanonLesothoLiberiaLibyaLiechtensteinLithuaniaLow & middle incomeLow incomeLower middle incomeLuxembourgMacao SAR, ChinaMacedonia, FYRMadagascarMalawiMaldivesMaliMaltaMarshall IslandsMauritaniaMauritiusMexicoMicronesia, Fed. Sts.Middle East & North AfricaMiddle East & North Africa (excluding high income)Middle East & North Africa (IDA & IBRD countries)Middle incomeMoldovaMongoliaMontenegroMoroccoMozambiqueMyanmarNamibiaNauruNepalNetherlandsNew ZealandNicaraguaNigerNigeriaNorth AmericaNorwayOECD membersOmanOther small statesPacific island small statesPakistanPalauPanamaPapua New GuineaParaguayPeruPhilippinesPolandPortugalPost-demographic dividendPre-demographic dividendPuerto RicoQatarRomaniaRussian FederationRwandaSamoaSan MarinoSao Tome and PrincipeSaudi ArabiaSenegalSerbiaSeychellesSierra LeoneSlovak RepublicSloveniaSmall statesSolomon IslandsSouth AfricaSouth AsiaSouth Asia (IDA & IBRD)South SudanSpainSri LankaSt. Kitts and NevisSt. LuciaSt. Vincent and the GrenadinesSub-Saharan Africa Sub-Saharan Africa (excluding high income)Sub-Saharan Africa (IDA & IBRD countries)SudanSurinameSwazilandSwedenSwitzerlandSyrian Arab RepublicTajikistanTanzaniaThailandTimor-LesteTogoTongaTrinidad and TobagoTunisiaTurkeyTuvaluUgandaUkraineUnited Arab EmiratesUnited StatesUpper middle incomeUruguayUzbekistanVanuatuVenezuela, RBVietnamWest Bank and GazaWorldYemen, Rep.ZambiaZimbabwe Timeline:
This timeline shows a graph from 1972 to 2015 of Ecuador. No data until 1971. Number of actual observations by date: 31.
Source name:
World Development Indicators
Source organization:
UNESCO Institute for Statistics
Categories, topics:
Education, Gender
Last updated:
apr 23, 2017
Indicators value changes by year
Minimum:
111.336
jan 1, 2015
Maximum:
153.259
jan 1, 1988
At the date of observation
Value
Absolute change
Change from previous value
jan 1, 1972
130.227
+130.227
0.0%
jan 1, 1973
124.851
-5.376
-4.13%
jan 1, 1974
130.286
+5.435
4.35%
jan 1, 1975
129.716
-0.57
-0.44%
jan 1, 1976
131.069
+1.353
1.04%
jan 1, 1977
129.602
-1.467
-1.12%
jan 1, 1978
129.729
+0.127
0.1%
jan 1, 1979
132.276
+2.547
1.96%
jan 1, 1980
136.589
+4.313
3.26%
jan 1, 1981
136.822
+0.233
0.17%
jan 1, 1988
153.259
+16.437
12.01%
jan 1, 1989
152.945
-0.314
-0.21%
jan 1, 1995
125.846
-27.099
-17.72%
jan 1, 1996
125.622
-0.224
-0.18%
jan 1, 1997
126.094
+0.472
0.38%
jan 1, 1998
128.648
+2.554
2.03%
jan 1, 1999
127.121
-1.526
-1.19%
jan 1, 2000
127.561
+0.439
0.35%
jan 1, 2001
130.923
+3.362
2.64%
jan 1, 2002
132.689
+1.766
1.35%
jan 1, 2003
132.669
-0.02
-0.01%
jan 1, 2004
130.725
-1.943
-1.46%
jan 1, 2005
128.092
-2.633
-2.01%
jan 1, 2006
125.646
-2.446
-1.91%
jan 1, 2007
130.664
+5.018
3.99%
jan 1, 2008
132.622
+1.957
1.5%
jan 1, 2011
120.973
-11.649
-8.78%
jan 1, 2012
118.555
-2.418
-2.0%
jan 1, 2013
115.653
-2.902
-2.45%
jan 1, 2014
117.107
+1.454
1.26%
jan 1, 2015
111.336
-5.771
-4.93%
Ranking of countries by current statistics by years


Comments: