29
/
en
AIzaSyAYiBZKx7MnpbEhh9jyipgxe19OcubqV5w
April 1, 2024
50066
Middle East & North Africa (IDA & IBRD countries)
TMN
false
2
1
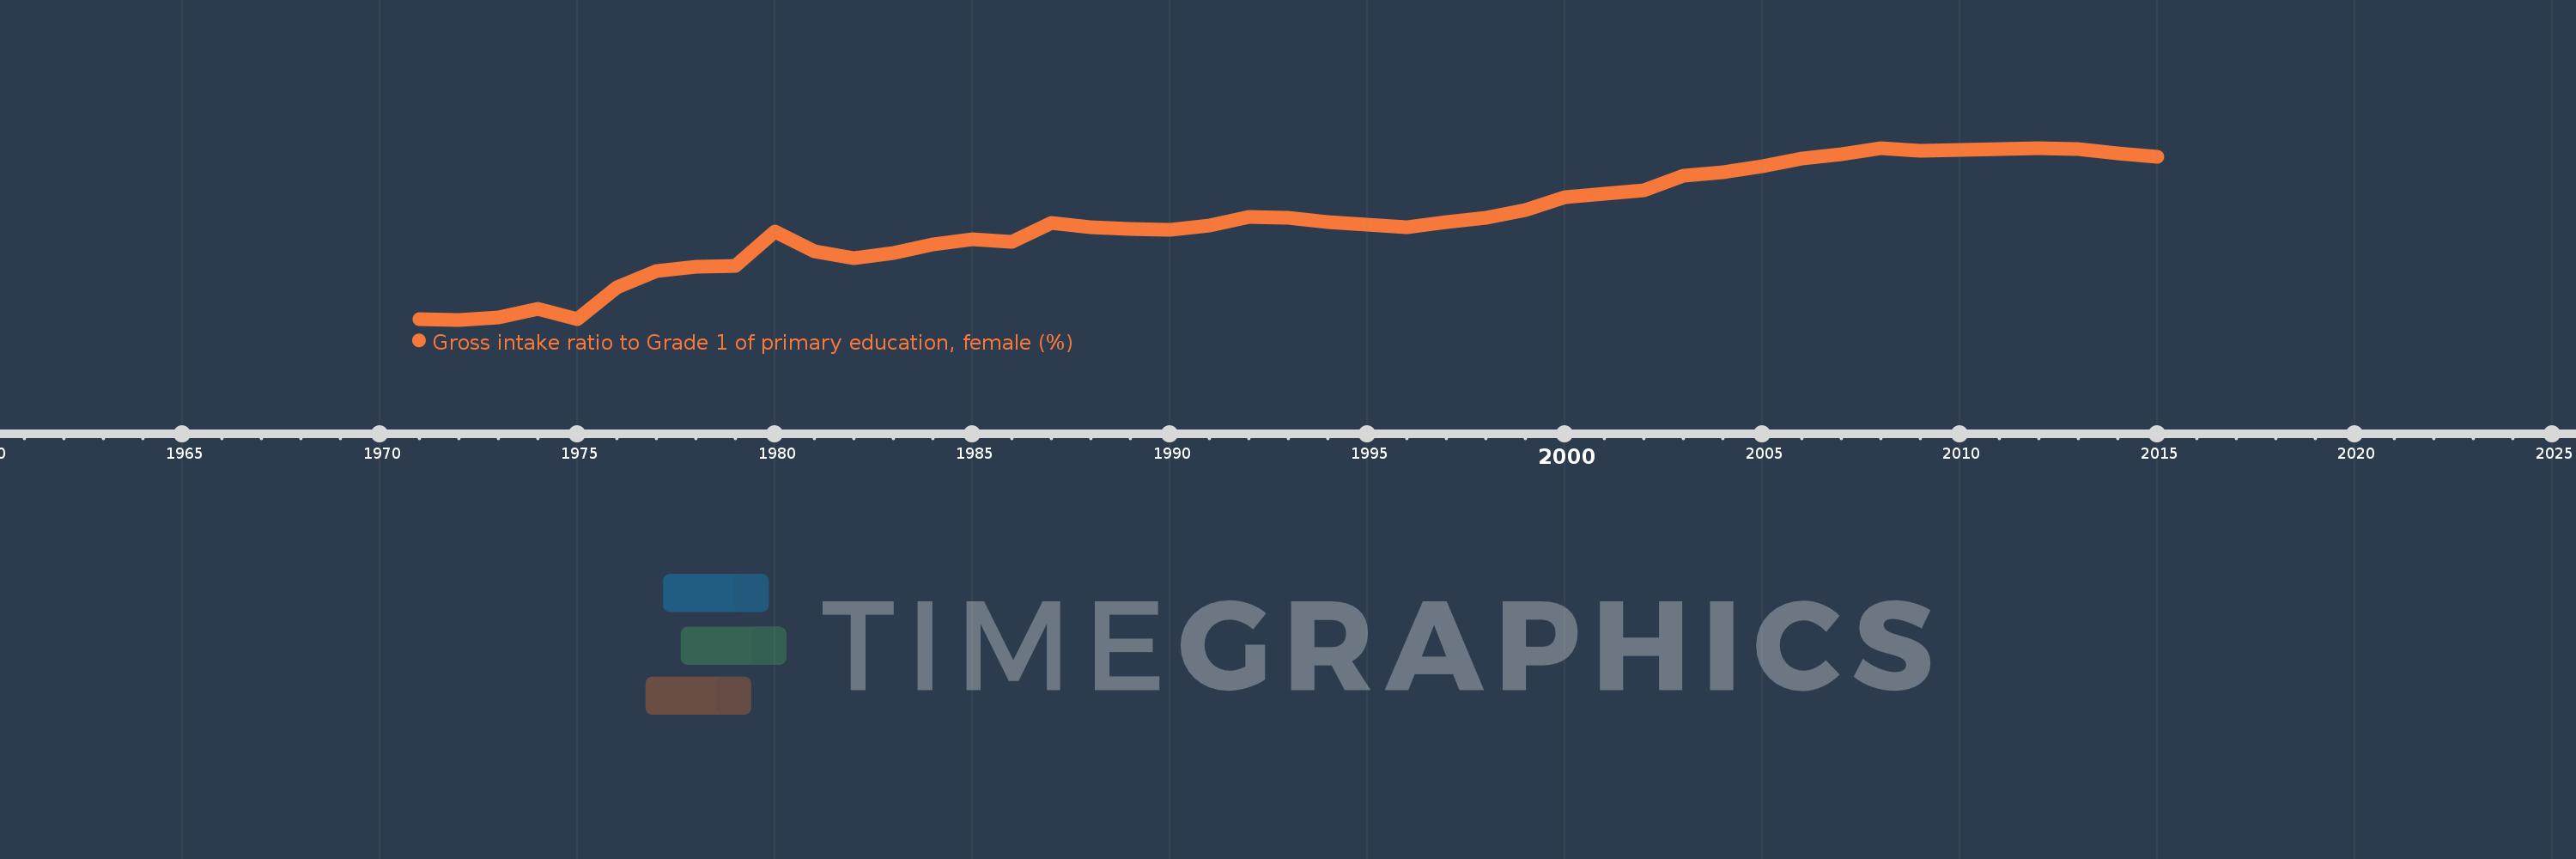
Gross intake ratio to Grade 1 of primary education, female (%)
2015,2014,2013,2012,2011,2010,2009,2008,2007,2006,2005,2004,2003,2002,2001,2000,1999,1998,1997,1996,1995,1994,1993,1992,1991,1990,1989,1988,1987,1986,1985,1984,1983,1982,1981,1980,1979,1978,1977,1976,1975,1974,1973,1972,1971
This statistics in other country:
AfghanistanAlbaniaAlgeriaAngolaAntigua and BarbudaArab WorldArgentinaArmeniaArubaAustriaAzerbaijanBahamas, TheBahrainBangladeshBarbadosBelarusBelgiumBelizeBeninBermudaBhutanBoliviaBosnia and HerzegovinaBotswanaBrazilBrunei DarussalamBulgariaBurkina FasoBurundiCabo VerdeCambodiaCameroonCanadaCaribbean small statesCentral African RepublicCentral Europe and the BalticsChadChileChinaColombiaComorosCongo, Dem. Rep.Congo, Rep.Costa RicaCote d'IvoireCroatiaCubaCyprusCzech RepublicDenmarkDjiboutiDominicaDominican RepublicEarly-demographic dividendEast Asia & PacificEast Asia & Pacific (excluding high income)East Asia & Pacific (IDA & IBRD countries)EcuadorEgypt, Arab Rep.El SalvadorEquatorial GuineaEritreaEstoniaEthiopiaEuro areaEurope & Central AsiaEurope & Central Asia (excluding high income)Europe & Central Asia (IDA & IBRD countries)European UnionFijiFinlandFragile and conflict affected situationsFranceGabonGambia, TheGeorgiaGermanyGhanaGreeceGrenadaGuatemalaGuineaGuinea-BissauGuyanaHaitiHeavily indebted poor countries (HIPC)High incomeHondurasHong Kong SAR, ChinaHungaryIBRD onlyIcelandIDA & IBRD totalIDA blendIDA onlyIDA totalIndiaIndonesiaIran, Islamic Rep.IraqIrelandIsraelItalyJamaicaJapanJordanKazakhstanKenyaKiribatiKorea, Dem. People’s Rep.Korea, Rep.KuwaitKyrgyz RepublicLao PDRLate-demographic dividendLatin America & Caribbean Latin America & Caribbean (excluding high income)Latin America & the Caribbean (IDA & IBRD countries)LatviaLeast developed countries: UN classificationLebanonLesothoLiberiaLibyaLiechtensteinLithuaniaLow & middle incomeLow incomeLower middle incomeLuxembourgMacao SAR, ChinaMacedonia, FYRMadagascarMalawiMaldivesMaliMaltaMarshall IslandsMauritaniaMauritiusMexicoMicronesia, Fed. Sts.Middle East & North AfricaMiddle East & North Africa (excluding high income)Middle East & North Africa (IDA & IBRD countries)Middle incomeMoldovaMongoliaMontenegroMoroccoMozambiqueMyanmarNamibiaNauruNepalNetherlandsNew ZealandNicaraguaNigerNigeriaNorth AmericaNorwayOECD membersOmanOther small statesPacific island small statesPakistanPalauPanamaPapua New GuineaParaguayPeruPhilippinesPolandPortugalPost-demographic dividendPre-demographic dividendPuerto RicoQatarRomaniaRussian FederationRwandaSamoaSan MarinoSao Tome and PrincipeSaudi ArabiaSenegalSerbiaSeychellesSierra LeoneSlovak RepublicSloveniaSmall statesSolomon IslandsSouth AfricaSouth AsiaSouth Asia (IDA & IBRD)South SudanSpainSri LankaSt. Kitts and NevisSt. LuciaSt. Vincent and the GrenadinesSub-Saharan Africa Sub-Saharan Africa (excluding high income)Sub-Saharan Africa (IDA & IBRD countries)SudanSurinameSwazilandSwedenSwitzerlandSyrian Arab RepublicTajikistanTanzaniaThailandTimor-LesteTogoTongaTrinidad and TobagoTunisiaTurkeyTuvaluUgandaUkraineUnited Arab EmiratesUnited StatesUpper middle incomeUruguayUzbekistanVanuatuVenezuela, RBVietnamWest Bank and GazaWorldYemen, Rep.ZambiaZimbabwe Timeline:
This timeline shows a graph from 1971 to 2015 of Middle East & North Africa (IDA & IBRD countries). No data until 1970. Number of actual observations by date: 45.
Source name:
World Development Indicators
Source organization:
UNESCO Institute for Statistics
Categories, topics:
Education, Gender
Last updated:
apr 23, 2017
Indicators value changes by year
Minimum:
61.227
jan 1, 1972
Maximum:
106.287
jan 1, 2012
At the date of observation
Value
Absolute change
Change from previous value
jan 1, 1971
61.286
+61.286
0.0%
jan 1, 1972
61.227
-0.059
-0.1%
jan 1, 1973
61.865
+0.638
1.04%
jan 1, 1974
63.991
+2.126
3.44%
jan 1, 1975
61.281
-2.71
-4.24%
jan 1, 1976
69.741
+8.46
13.81%
jan 1, 1977
74.012
+4.271
6.12%
jan 1, 1978
75.178
+1.166
1.58%
jan 1, 1979
75.261
+0.084
0.11%
jan 1, 1980
84.426
+9.165
12.18%
jan 1, 1981
79.281
-5.146
-6.09%
jan 1, 1982
77.457
-1.823
-2.3%
jan 1, 1983
78.735
+1.278
1.65%
jan 1, 1984
80.995
+2.26
2.87%
jan 1, 1985
82.332
+1.337
1.65%
jan 1, 1986
81.774
-0.558
-0.68%
jan 1, 1987
86.516
+4.742
5.8%
jan 1, 1988
85.512
-1.004
-1.16%
jan 1, 1989
85.102
-0.411
-0.48%
jan 1, 1990
84.892
-0.209
-0.25%
jan 1, 1991
86.028
+1.136
1.34%
jan 1, 1992
88.187
+2.159
2.51%
jan 1, 1993
87.939
-0.248
-0.28%
jan 1, 1994
86.735
-1.204
-1.37%
jan 1, 1995
86.253
-0.482
-0.56%
jan 1, 1996
85.486
-0.767
-0.89%
jan 1, 1997
86.939
+1.453
1.7%
jan 1, 1998
87.973
+1.033
1.19%
jan 1, 1999
89.971
+1.999
2.27%
jan 1, 2000
93.277
+3.306
3.67%
jan 1, 2001
94.303
+1.026
1.1%
jan 1, 2002
95.292
+0.988
1.05%
jan 1, 2003
99.058
+3.767
3.95%
jan 1, 2004
99.95
+0.892
0.9%
jan 1, 2005
101.381
+1.431
1.43%
jan 1, 2006
103.485
+2.104
2.08%
jan 1, 2007
104.742
+1.257
1.21%
jan 1, 2008
106.174
+1.432
1.37%
jan 1, 2009
105.514
-0.66
-0.62%
jan 1, 2010
105.693
+0.18
0.17%
jan 1, 2011
105.923
+0.23
0.22%
jan 1, 2012
106.287
+0.364
0.34%
jan 1, 2013
106.08
-0.207
-0.19%
jan 1, 2014
104.811
-1.269
-1.2%
jan 1, 2015
104.032
-0.779
-0.74%
Ranking of countries by current statistics by years


Comments: