29
/
en
AIzaSyAYiBZKx7MnpbEhh9jyipgxe19OcubqV5w
April 1, 2024
44298
Least developed countries: UN classification
LDC
false
2
1
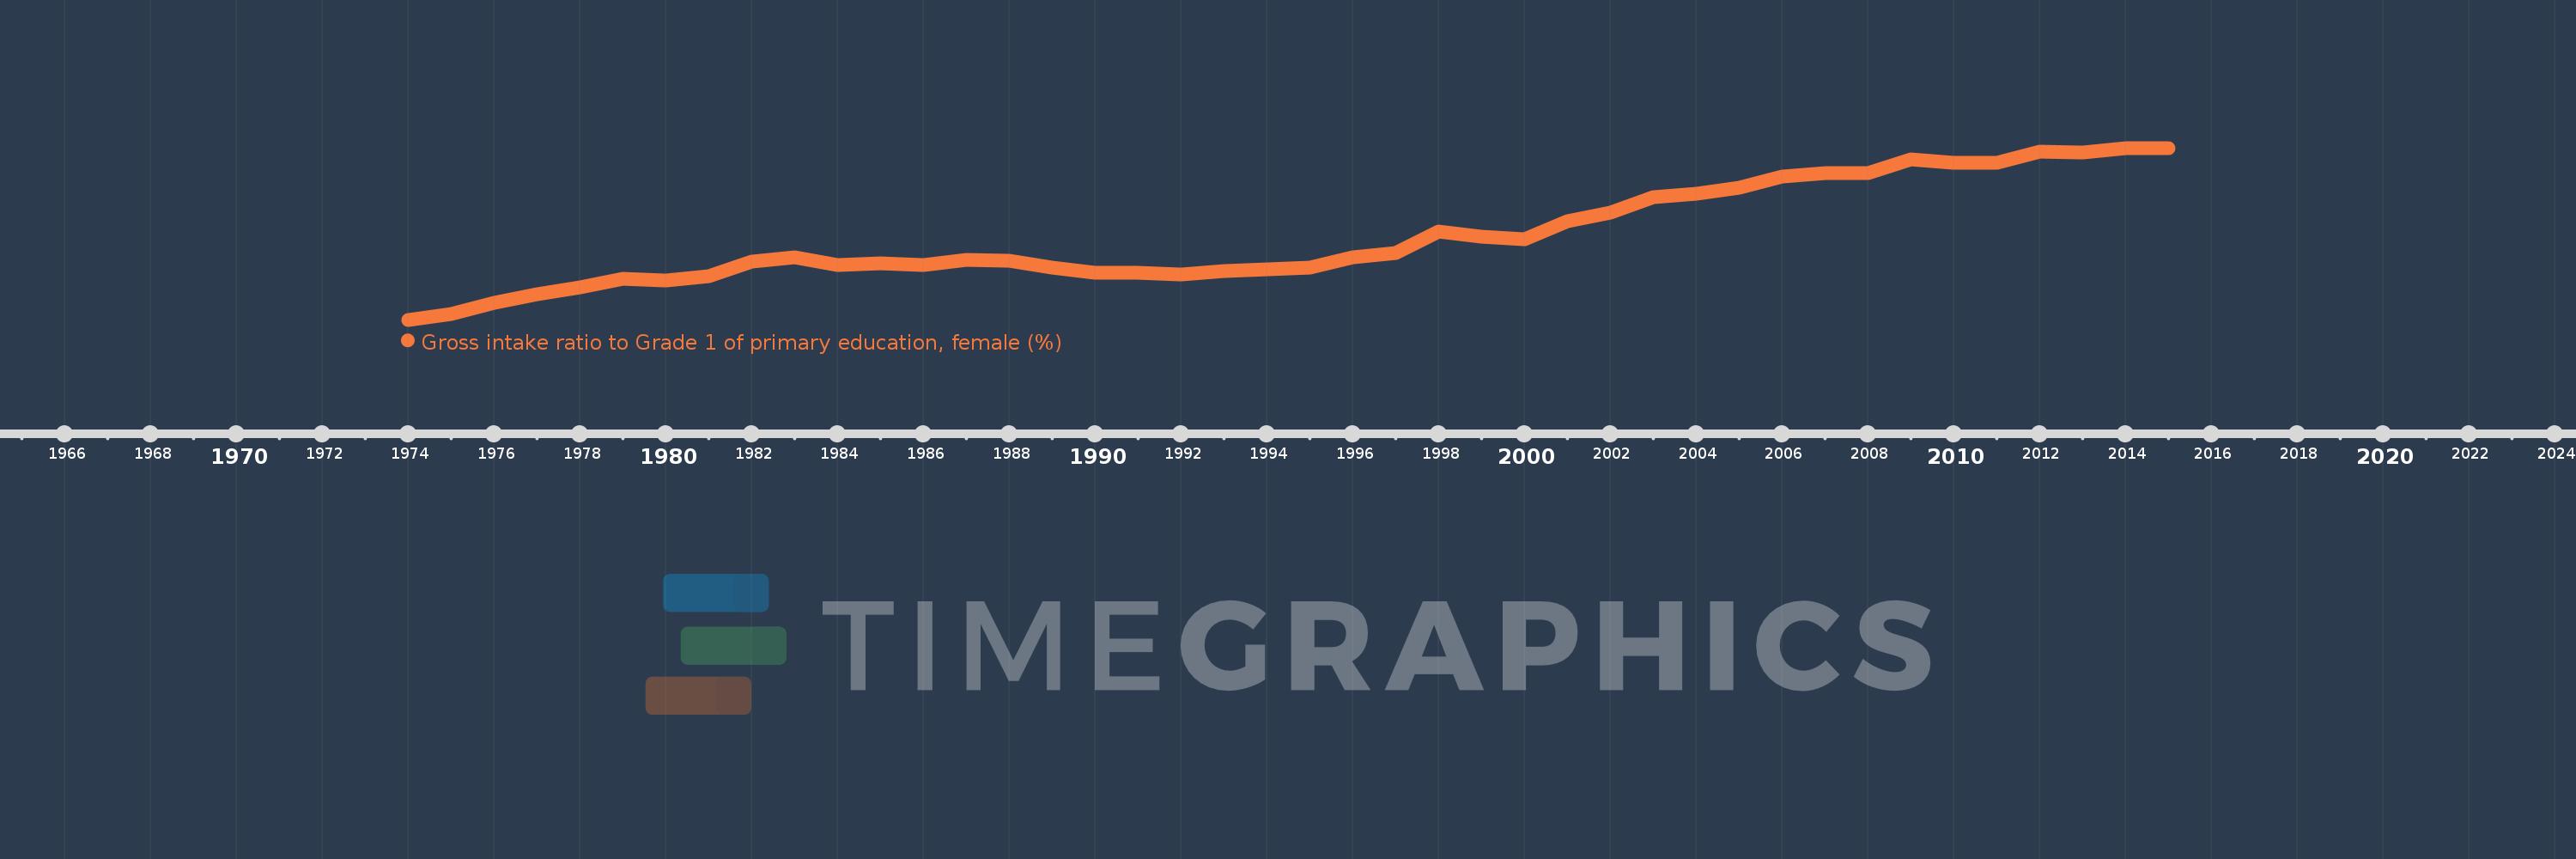
Gross intake ratio to Grade 1 of primary education, female (%)
2015,2014,2013,2012,2011,2010,2009,2008,2007,2006,2005,2004,2003,2002,2001,2000,1999,1998,1997,1996,1995,1994,1993,1992,1991,1990,1989,1988,1987,1986,1985,1984,1983,1982,1981,1980,1979,1978,1977,1976,1975,1974
This statistics in other country:
AfghanistanAlbaniaAlgeriaAngolaAntigua and BarbudaArab WorldArgentinaArmeniaArubaAustriaAzerbaijanBahamas, TheBahrainBangladeshBarbadosBelarusBelgiumBelizeBeninBermudaBhutanBoliviaBosnia and HerzegovinaBotswanaBrazilBrunei DarussalamBulgariaBurkina FasoBurundiCabo VerdeCambodiaCameroonCanadaCaribbean small statesCentral African RepublicCentral Europe and the BalticsChadChileChinaColombiaComorosCongo, Dem. Rep.Congo, Rep.Costa RicaCote d'IvoireCroatiaCubaCyprusCzech RepublicDenmarkDjiboutiDominicaDominican RepublicEarly-demographic dividendEast Asia & PacificEast Asia & Pacific (excluding high income)East Asia & Pacific (IDA & IBRD countries)EcuadorEgypt, Arab Rep.El SalvadorEquatorial GuineaEritreaEstoniaEthiopiaEuro areaEurope & Central AsiaEurope & Central Asia (excluding high income)Europe & Central Asia (IDA & IBRD countries)European UnionFijiFinlandFragile and conflict affected situationsFranceGabonGambia, TheGeorgiaGermanyGhanaGreeceGrenadaGuatemalaGuineaGuinea-BissauGuyanaHaitiHeavily indebted poor countries (HIPC)High incomeHondurasHong Kong SAR, ChinaHungaryIBRD onlyIcelandIDA & IBRD totalIDA blendIDA onlyIDA totalIndiaIndonesiaIran, Islamic Rep.IraqIrelandIsraelItalyJamaicaJapanJordanKazakhstanKenyaKiribatiKorea, Dem. People’s Rep.Korea, Rep.KuwaitKyrgyz RepublicLao PDRLate-demographic dividendLatin America & Caribbean Latin America & Caribbean (excluding high income)Latin America & the Caribbean (IDA & IBRD countries)LatviaLeast developed countries: UN classificationLebanonLesothoLiberiaLibyaLiechtensteinLithuaniaLow & middle incomeLow incomeLower middle incomeLuxembourgMacao SAR, ChinaMacedonia, FYRMadagascarMalawiMaldivesMaliMaltaMarshall IslandsMauritaniaMauritiusMexicoMicronesia, Fed. Sts.Middle East & North AfricaMiddle East & North Africa (excluding high income)Middle East & North Africa (IDA & IBRD countries)Middle incomeMoldovaMongoliaMontenegroMoroccoMozambiqueMyanmarNamibiaNauruNepalNetherlandsNew ZealandNicaraguaNigerNigeriaNorth AmericaNorwayOECD membersOmanOther small statesPacific island small statesPakistanPalauPanamaPapua New GuineaParaguayPeruPhilippinesPolandPortugalPost-demographic dividendPre-demographic dividendPuerto RicoQatarRomaniaRussian FederationRwandaSamoaSan MarinoSao Tome and PrincipeSaudi ArabiaSenegalSerbiaSeychellesSierra LeoneSlovak RepublicSloveniaSmall statesSolomon IslandsSouth AfricaSouth AsiaSouth Asia (IDA & IBRD)South SudanSpainSri LankaSt. Kitts and NevisSt. LuciaSt. Vincent and the GrenadinesSub-Saharan Africa Sub-Saharan Africa (excluding high income)Sub-Saharan Africa (IDA & IBRD countries)SudanSurinameSwazilandSwedenSwitzerlandSyrian Arab RepublicTajikistanTanzaniaThailandTimor-LesteTogoTongaTrinidad and TobagoTunisiaTurkeyTuvaluUgandaUkraineUnited Arab EmiratesUnited StatesUpper middle incomeUruguayUzbekistanVanuatuVenezuela, RBVietnamWest Bank and GazaWorldYemen, Rep.ZambiaZimbabwe Timeline:
This timeline shows a graph from 1974 to 2015 of Least developed countries: UN classification. No data until 1973. Number of actual observations by date: 42.
Source name:
World Development Indicators
Source organization:
UNESCO Institute for Statistics
Categories, topics:
Education, Gender
Last updated:
apr 23, 2017
Indicators value changes by year
Minimum:
58.326
jan 1, 1974
Maximum:
121.352
jan 1, 2014
At the date of observation
Value
Absolute change
Change from previous value
jan 1, 1974
58.326
+58.326
0.0%
jan 1, 1975
60.452
+2.126
3.65%
jan 1, 1976
64.511
+4.059
6.71%
jan 1, 1977
67.733
+3.222
4.99%
jan 1, 1978
70.14
+2.408
3.56%
jan 1, 1979
73.323
+3.183
4.54%
jan 1, 1980
72.575
-0.748
-1.02%
jan 1, 1981
74.343
+1.768
2.44%
jan 1, 1982
79.517
+5.174
6.96%
jan 1, 1983
81.09
+1.573
1.98%
jan 1, 1984
78.347
-2.743
-3.38%
jan 1, 1985
78.889
+0.542
0.69%
jan 1, 1986
78.516
-0.373
-0.47%
jan 1, 1987
80.244
+1.728
2.2%
jan 1, 1988
79.86
-0.384
-0.48%
jan 1, 1989
77.526
-2.334
-2.92%
jan 1, 1990
75.686
-1.84
-2.37%
jan 1, 1991
75.572
-0.114
-0.15%
jan 1, 1992
74.981
-0.591
-0.78%
jan 1, 1993
76.165
+1.184
1.58%
jan 1, 1994
76.818
+0.653
0.86%
jan 1, 1995
77.457
+0.639
0.83%
jan 1, 1996
81.17
+3.713
4.79%
jan 1, 1997
82.68
+1.51
1.86%
jan 1, 1998
90.823
+8.143
9.85%
jan 1, 1999
88.888
-1.936
-2.13%
jan 1, 2000
87.738
-1.15
-1.29%
jan 1, 2001
94.564
+6.826
7.78%
jan 1, 2002
97.724
+3.16
3.34%
jan 1, 2003
103.176
+5.452
5.58%
jan 1, 2004
104.467
+1.291
1.25%
jan 1, 2005
106.897
+2.43
2.33%
jan 1, 2006
110.738
+3.841
3.59%
jan 1, 2007
111.974
+1.235
1.12%
jan 1, 2008
112.03
+0.056
0.05%
jan 1, 2009
117.102
+5.072
4.53%
jan 1, 2010
115.839
-1.263
-1.08%
jan 1, 2011
115.77
-0.069
-0.06%
jan 1, 2012
120.015
+4.245
3.67%
jan 1, 2013
119.831
-0.184
-0.15%
jan 1, 2014
121.352
+1.521
1.27%
jan 1, 2015
121.186
-0.166
-0.14%
Ranking of countries by current statistics by years


Comments: