29
/
en
AIzaSyAYiBZKx7MnpbEhh9jyipgxe19OcubqV5w
April 1, 2024
45131
Low & middle income
LMY
false
2
1
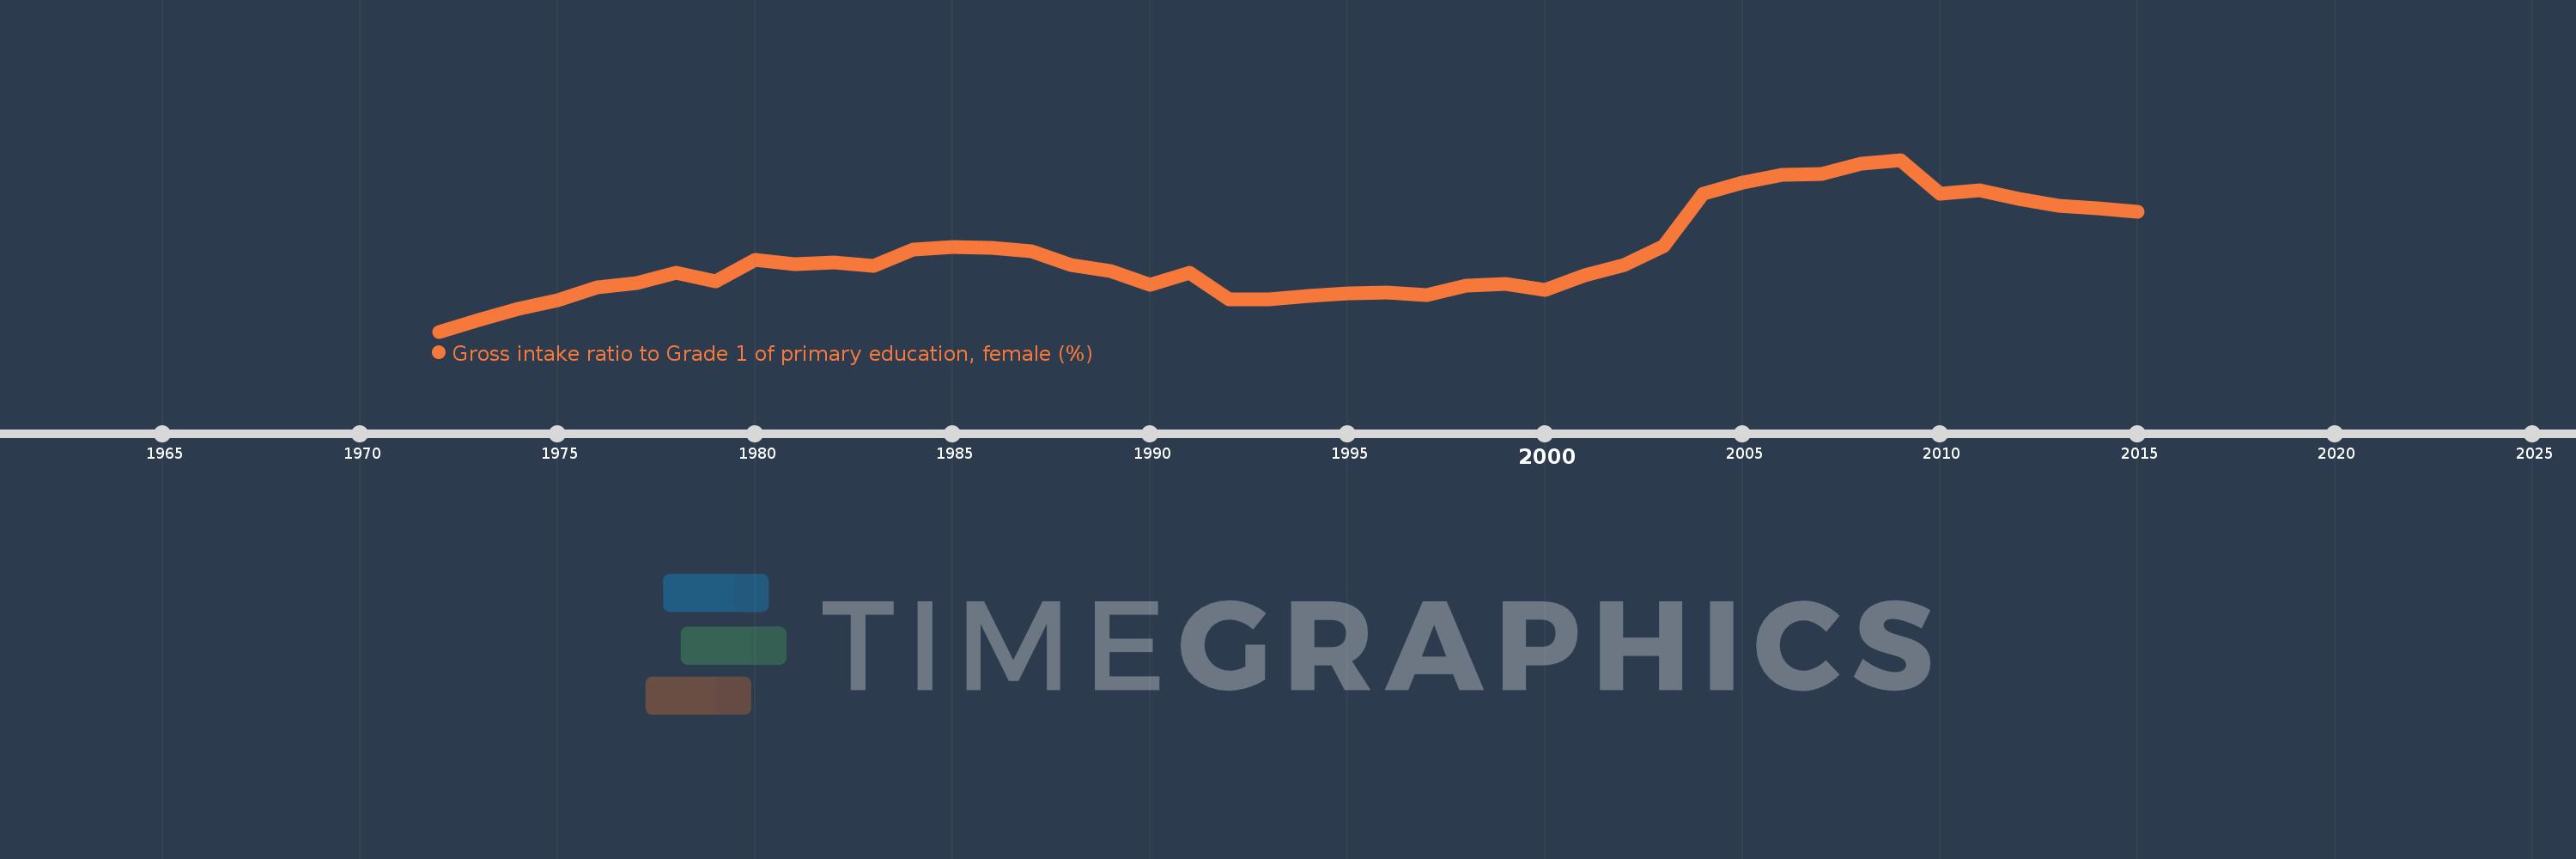
Gross intake ratio to Grade 1 of primary education, female (%)
2015,2014,2013,2012,2011,2010,2009,2008,2007,2006,2005,2004,2003,2002,2001,2000,1999,1998,1997,1996,1995,1994,1993,1992,1991,1990,1989,1988,1987,1986,1985,1984,1983,1982,1981,1980,1979,1978,1977,1976,1975,1974,1973,1972
This statistics in other country:
AfghanistanAlbaniaAlgeriaAngolaAntigua and BarbudaArab WorldArgentinaArmeniaArubaAustriaAzerbaijanBahamas, TheBahrainBangladeshBarbadosBelarusBelgiumBelizeBeninBermudaBhutanBoliviaBosnia and HerzegovinaBotswanaBrazilBrunei DarussalamBulgariaBurkina FasoBurundiCabo VerdeCambodiaCameroonCanadaCaribbean small statesCentral African RepublicCentral Europe and the BalticsChadChileChinaColombiaComorosCongo, Dem. Rep.Congo, Rep.Costa RicaCote d'IvoireCroatiaCubaCyprusCzech RepublicDenmarkDjiboutiDominicaDominican RepublicEarly-demographic dividendEast Asia & PacificEast Asia & Pacific (excluding high income)East Asia & Pacific (IDA & IBRD countries)EcuadorEgypt, Arab Rep.El SalvadorEquatorial GuineaEritreaEstoniaEthiopiaEuro areaEurope & Central AsiaEurope & Central Asia (excluding high income)Europe & Central Asia (IDA & IBRD countries)European UnionFijiFinlandFragile and conflict affected situationsFranceGabonGambia, TheGeorgiaGermanyGhanaGreeceGrenadaGuatemalaGuineaGuinea-BissauGuyanaHaitiHeavily indebted poor countries (HIPC)High incomeHondurasHong Kong SAR, ChinaHungaryIBRD onlyIcelandIDA & IBRD totalIDA blendIDA onlyIDA totalIndiaIndonesiaIran, Islamic Rep.IraqIrelandIsraelItalyJamaicaJapanJordanKazakhstanKenyaKiribatiKorea, Dem. People’s Rep.Korea, Rep.KuwaitKyrgyz RepublicLao PDRLate-demographic dividendLatin America & Caribbean Latin America & Caribbean (excluding high income)Latin America & the Caribbean (IDA & IBRD countries)LatviaLeast developed countries: UN classificationLebanonLesothoLiberiaLibyaLiechtensteinLithuaniaLow & middle incomeLow incomeLower middle incomeLuxembourgMacao SAR, ChinaMacedonia, FYRMadagascarMalawiMaldivesMaliMaltaMarshall IslandsMauritaniaMauritiusMexicoMicronesia, Fed. Sts.Middle East & North AfricaMiddle East & North Africa (excluding high income)Middle East & North Africa (IDA & IBRD countries)Middle incomeMoldovaMongoliaMontenegroMoroccoMozambiqueMyanmarNamibiaNauruNepalNetherlandsNew ZealandNicaraguaNigerNigeriaNorth AmericaNorwayOECD membersOmanOther small statesPacific island small statesPakistanPalauPanamaPapua New GuineaParaguayPeruPhilippinesPolandPortugalPost-demographic dividendPre-demographic dividendPuerto RicoQatarRomaniaRussian FederationRwandaSamoaSan MarinoSao Tome and PrincipeSaudi ArabiaSenegalSerbiaSeychellesSierra LeoneSlovak RepublicSloveniaSmall statesSolomon IslandsSouth AfricaSouth AsiaSouth Asia (IDA & IBRD)South SudanSpainSri LankaSt. Kitts and NevisSt. LuciaSt. Vincent and the GrenadinesSub-Saharan Africa Sub-Saharan Africa (excluding high income)Sub-Saharan Africa (IDA & IBRD countries)SudanSurinameSwazilandSwedenSwitzerlandSyrian Arab RepublicTajikistanTanzaniaThailandTimor-LesteTogoTongaTrinidad and TobagoTunisiaTurkeyTuvaluUgandaUkraineUnited Arab EmiratesUnited StatesUpper middle incomeUruguayUzbekistanVanuatuVenezuela, RBVietnamWest Bank and GazaWorldYemen, Rep.ZambiaZimbabwe Timeline:
This timeline shows a graph from 1972 to 2015 of Low & middle income. No data until 1971. Number of actual observations by date: 44.
Source name:
World Development Indicators
Source organization:
UNESCO Institute for Statistics
Categories, topics:
Education, Gender
Last updated:
apr 23, 2017
Indicators value changes by year
Minimum:
95.188
jan 1, 1972
Maximum:
113.023
jan 1, 2009
At the date of observation
Value
Absolute change
Change from previous value
jan 1, 1972
95.188
+95.188
0.0%
jan 1, 1973
96.407
+1.219
1.28%
jan 1, 1974
97.538
+1.13
1.17%
jan 1, 1975
98.444
+0.906
0.93%
jan 1, 1976
99.823
+1.379
1.4%
jan 1, 1977
100.183
+0.359
0.36%
jan 1, 1978
101.304
+1.122
1.12%
jan 1, 1979
100.431
-0.873
-0.86%
jan 1, 1980
102.664
+2.233
2.22%
jan 1, 1981
102.2
-0.465
-0.45%
jan 1, 1982
102.36
+0.16
0.16%
jan 1, 1983
102.046
-0.314
-0.31%
jan 1, 1984
103.668
+1.622
1.59%
jan 1, 1985
103.985
+0.316
0.31%
jan 1, 1986
103.89
-0.095
-0.09%
jan 1, 1987
103.544
-0.346
-0.33%
jan 1, 1988
102.079
-1.465
-1.41%
jan 1, 1989
101.461
-0.618
-0.61%
jan 1, 1990
100.023
-1.438
-1.42%
jan 1, 1991
101.252
+1.229
1.23%
jan 1, 1992
98.518
-2.735
-2.7%
jan 1, 1993
98.544
+0.027
0.03%
jan 1, 1994
98.868
+0.324
0.33%
jan 1, 1995
99.133
+0.264
0.27%
jan 1, 1996
99.274
+0.141
0.14%
jan 1, 1997
99.012
-0.262
-0.26%
jan 1, 1998
99.984
+0.972
0.98%
jan 1, 1999
100.145
+0.161
0.16%
jan 1, 2000
99.537
-0.607
-0.61%
jan 1, 2001
101.067
+1.529
1.54%
jan 1, 2002
102.062
+0.995
0.98%
jan 1, 2003
104.074
+2.012
1.97%
jan 1, 2004
109.534
+5.46
5.25%
jan 1, 2005
110.618
+1.084
0.99%
jan 1, 2006
111.485
+0.867
0.78%
jan 1, 2007
111.531
+0.046
0.04%
jan 1, 2008
112.622
+1.091
0.98%
jan 1, 2009
113.023
+0.4
0.36%
jan 1, 2010
109.485
-3.538
-3.13%
jan 1, 2011
109.857
+0.372
0.34%
jan 1, 2012
108.992
-0.865
-0.79%
jan 1, 2013
108.236
-0.756
-0.69%
jan 1, 2014
108.024
-0.211
-0.2%
jan 1, 2015
107.598
-0.427
-0.4%
Ranking of countries by current statistics by years


Comments: