29
/
en
AIzaSyAYiBZKx7MnpbEhh9jyipgxe19OcubqV5w
April 1, 2024
193089
Mauritania
MRT
true
2
1
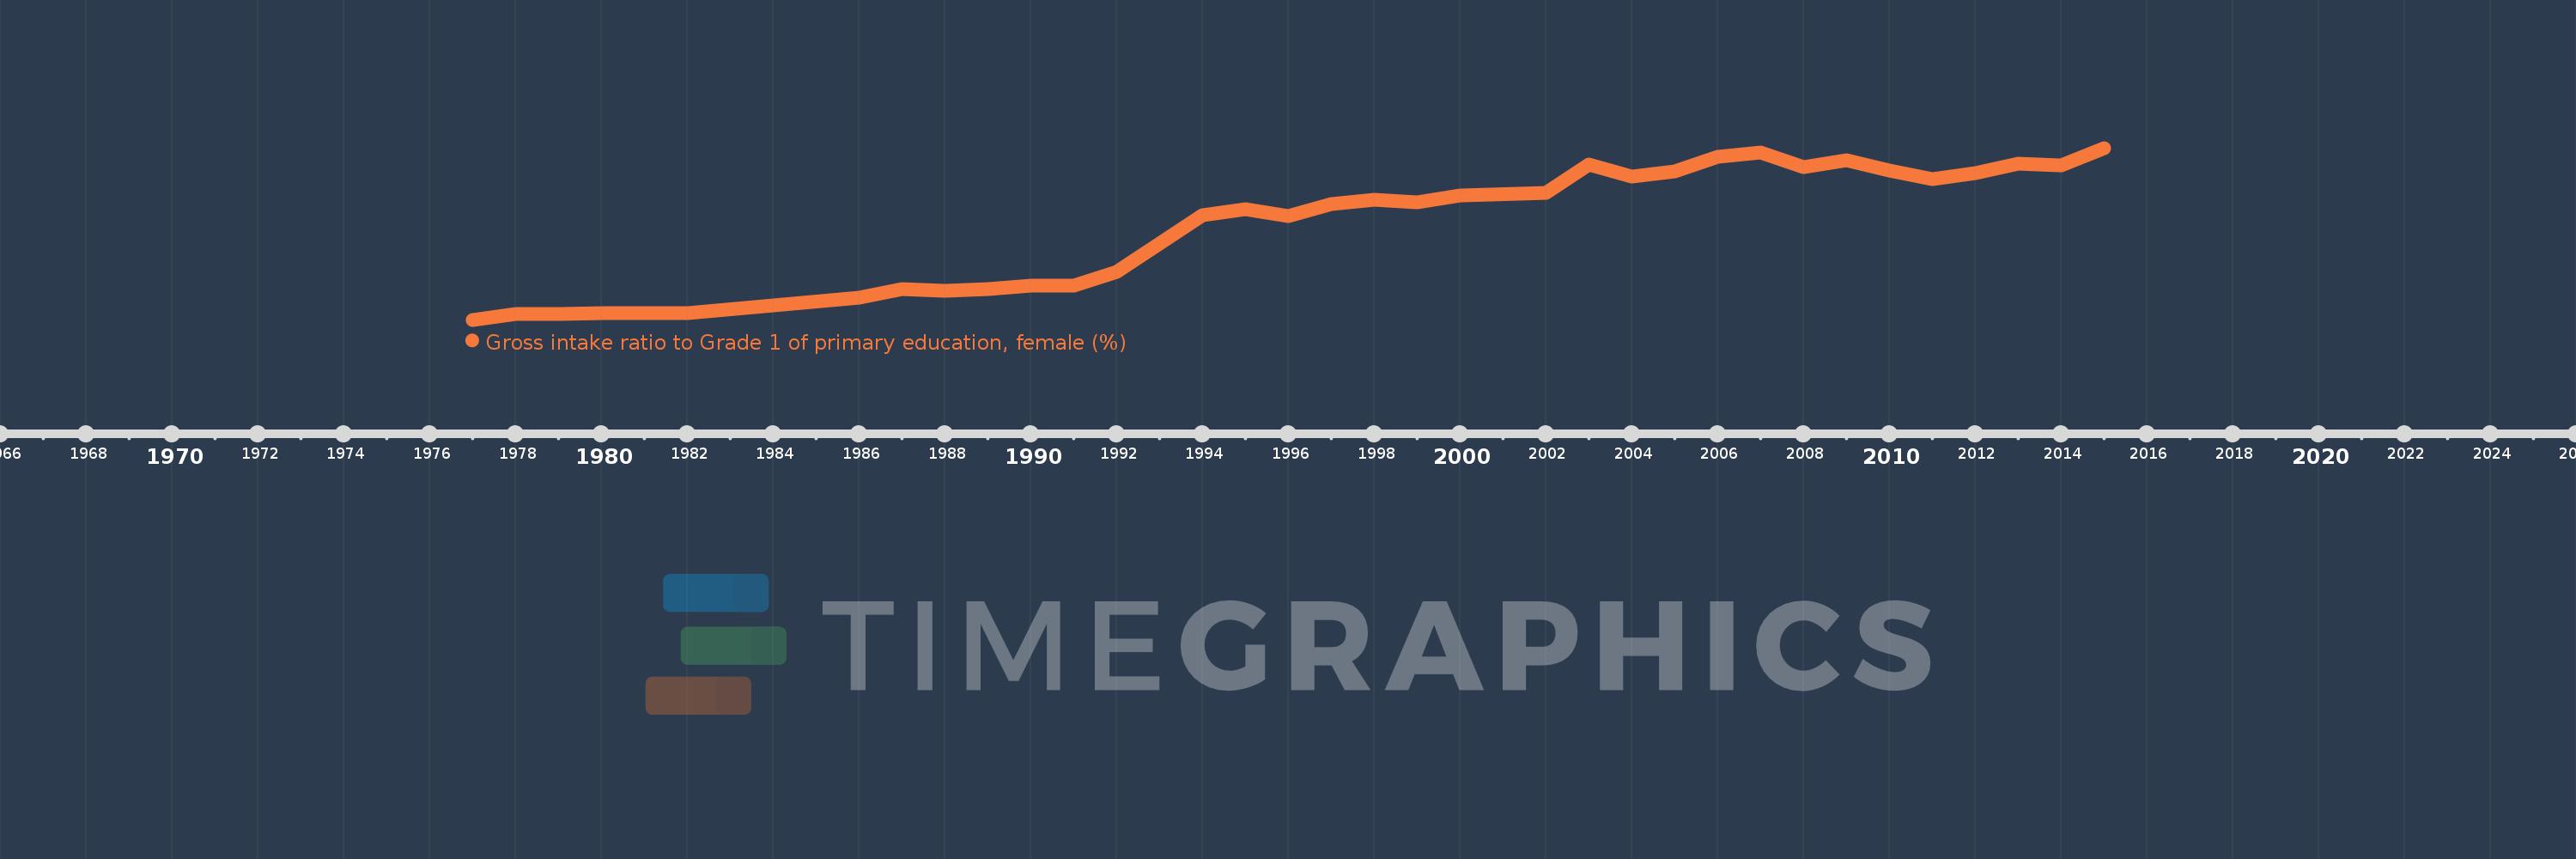
Gross intake ratio to Grade 1 of primary education, female (%)
2015,2014,2013,2012,2011,2010,2009,2008,2007,2006,2005,2004,2003,2002,2000,1999,1998,1997,1996,1995,1994,1993,1992,1991,1990,1989,1988,1987,1986,1982,1980,1979,1978,1977
This statistics in other country:
AfghanistanAlbaniaAlgeriaAngolaAntigua and BarbudaArab WorldArgentinaArmeniaArubaAustriaAzerbaijanBahamas, TheBahrainBangladeshBarbadosBelarusBelgiumBelizeBeninBermudaBhutanBoliviaBosnia and HerzegovinaBotswanaBrazilBrunei DarussalamBulgariaBurkina FasoBurundiCabo VerdeCambodiaCameroonCanadaCaribbean small statesCentral African RepublicCentral Europe and the BalticsChadChileChinaColombiaComorosCongo, Dem. Rep.Congo, Rep.Costa RicaCote d'IvoireCroatiaCubaCyprusCzech RepublicDenmarkDjiboutiDominicaDominican RepublicEarly-demographic dividendEast Asia & PacificEast Asia & Pacific (excluding high income)East Asia & Pacific (IDA & IBRD countries)EcuadorEgypt, Arab Rep.El SalvadorEquatorial GuineaEritreaEstoniaEthiopiaEuro areaEurope & Central AsiaEurope & Central Asia (excluding high income)Europe & Central Asia (IDA & IBRD countries)European UnionFijiFinlandFragile and conflict affected situationsFranceGabonGambia, TheGeorgiaGermanyGhanaGreeceGrenadaGuatemalaGuineaGuinea-BissauGuyanaHaitiHeavily indebted poor countries (HIPC)High incomeHondurasHong Kong SAR, ChinaHungaryIBRD onlyIcelandIDA & IBRD totalIDA blendIDA onlyIDA totalIndiaIndonesiaIran, Islamic Rep.IraqIrelandIsraelItalyJamaicaJapanJordanKazakhstanKenyaKiribatiKorea, Dem. People’s Rep.Korea, Rep.KuwaitKyrgyz RepublicLao PDRLate-demographic dividendLatin America & Caribbean Latin America & Caribbean (excluding high income)Latin America & the Caribbean (IDA & IBRD countries)LatviaLeast developed countries: UN classificationLebanonLesothoLiberiaLibyaLiechtensteinLithuaniaLow & middle incomeLow incomeLower middle incomeLuxembourgMacao SAR, ChinaMacedonia, FYRMadagascarMalawiMaldivesMaliMaltaMarshall IslandsMauritaniaMauritiusMexicoMicronesia, Fed. Sts.Middle East & North AfricaMiddle East & North Africa (excluding high income)Middle East & North Africa (IDA & IBRD countries)Middle incomeMoldovaMongoliaMontenegroMoroccoMozambiqueMyanmarNamibiaNauruNepalNetherlandsNew ZealandNicaraguaNigerNigeriaNorth AmericaNorwayOECD membersOmanOther small statesPacific island small statesPakistanPalauPanamaPapua New GuineaParaguayPeruPhilippinesPolandPortugalPost-demographic dividendPre-demographic dividendPuerto RicoQatarRomaniaRussian FederationRwandaSamoaSan MarinoSao Tome and PrincipeSaudi ArabiaSenegalSerbiaSeychellesSierra LeoneSlovak RepublicSloveniaSmall statesSolomon IslandsSouth AfricaSouth AsiaSouth Asia (IDA & IBRD)South SudanSpainSri LankaSt. Kitts and NevisSt. LuciaSt. Vincent and the GrenadinesSub-Saharan Africa Sub-Saharan Africa (excluding high income)Sub-Saharan Africa (IDA & IBRD countries)SudanSurinameSwazilandSwedenSwitzerlandSyrian Arab RepublicTajikistanTanzaniaThailandTimor-LesteTogoTongaTrinidad and TobagoTunisiaTurkeyTuvaluUgandaUkraineUnited Arab EmiratesUnited StatesUpper middle incomeUruguayUzbekistanVanuatuVenezuela, RBVietnamWest Bank and GazaWorldYemen, Rep.ZambiaZimbabwe Timeline:
This timeline shows a graph from 1977 to 2015 of Mauritania. No data until 1976. Number of actual observations by date: 34.
Source name:
World Development Indicators
Source organization:
UNESCO Institute for Statistics
Categories, topics:
Education, Gender
Last updated:
apr 23, 2017
Indicators value changes by year
Minimum:
20.751
jan 1, 1977
Maximum:
118.193
jan 1, 2015
At the date of observation
Value
Absolute change
Change from previous value
jan 1, 1977
20.751
+20.751
0.0%
jan 1, 1978
24.075
+3.324
16.02%
jan 1, 1979
23.788
-0.287
-1.19%
jan 1, 1980
24.388
+0.601
2.52%
jan 1, 1982
24.648
+0.259
1.06%
jan 1, 1986
33.039
+8.392
34.05%
jan 1, 1987
37.945
+4.905
14.85%
jan 1, 1988
37.091
-0.854
-2.25%
jan 1, 1989
38.32
+1.229
3.31%
jan 1, 1990
40.205
+1.885
4.92%
jan 1, 1991
39.912
-0.293
-0.73%
jan 1, 1992
48.047
+8.135
20.38%
jan 1, 1993
64.046
+15.999
33.3%
jan 1, 1994
79.919
+15.873
24.78%
jan 1, 1995
83.648
+3.729
4.67%
jan 1, 1996
79.333
-4.315
-5.16%
jan 1, 1997
86.189
+6.857
8.64%
jan 1, 1998
88.839
+2.65
3.07%
jan 1, 1999
87.545
-1.295
-1.46%
jan 1, 2000
91.01
+3.466
3.96%
jan 1, 2002
92.479
+1.469
1.61%
jan 1, 2003
108.987
+16.509
17.85%
jan 1, 2004
101.949
-7.038
-6.46%
jan 1, 2005
104.875
+2.926
2.87%
jan 1, 2006
113.372
+8.497
8.1%
jan 1, 2007
115.805
+2.433
2.15%
jan 1, 2008
107.185
-8.62
-7.44%
jan 1, 2009
111.018
+3.833
3.58%
jan 1, 2010
105.4
-5.617
-5.06%
jan 1, 2011
100.323
-5.078
-4.82%
jan 1, 2012
103.972
+3.649
3.64%
jan 1, 2013
109.067
+5.095
4.9%
jan 1, 2014
108.187
-0.88
-0.81%
jan 1, 2015
118.193
+10.006
9.25%
Ranking of countries by current statistics by years


Comments: