29
/
en
AIzaSyAYiBZKx7MnpbEhh9jyipgxe19OcubqV5w
April 1, 2024
49049
Middle East & North Africa (excluding high income)
MNA
false
2
1
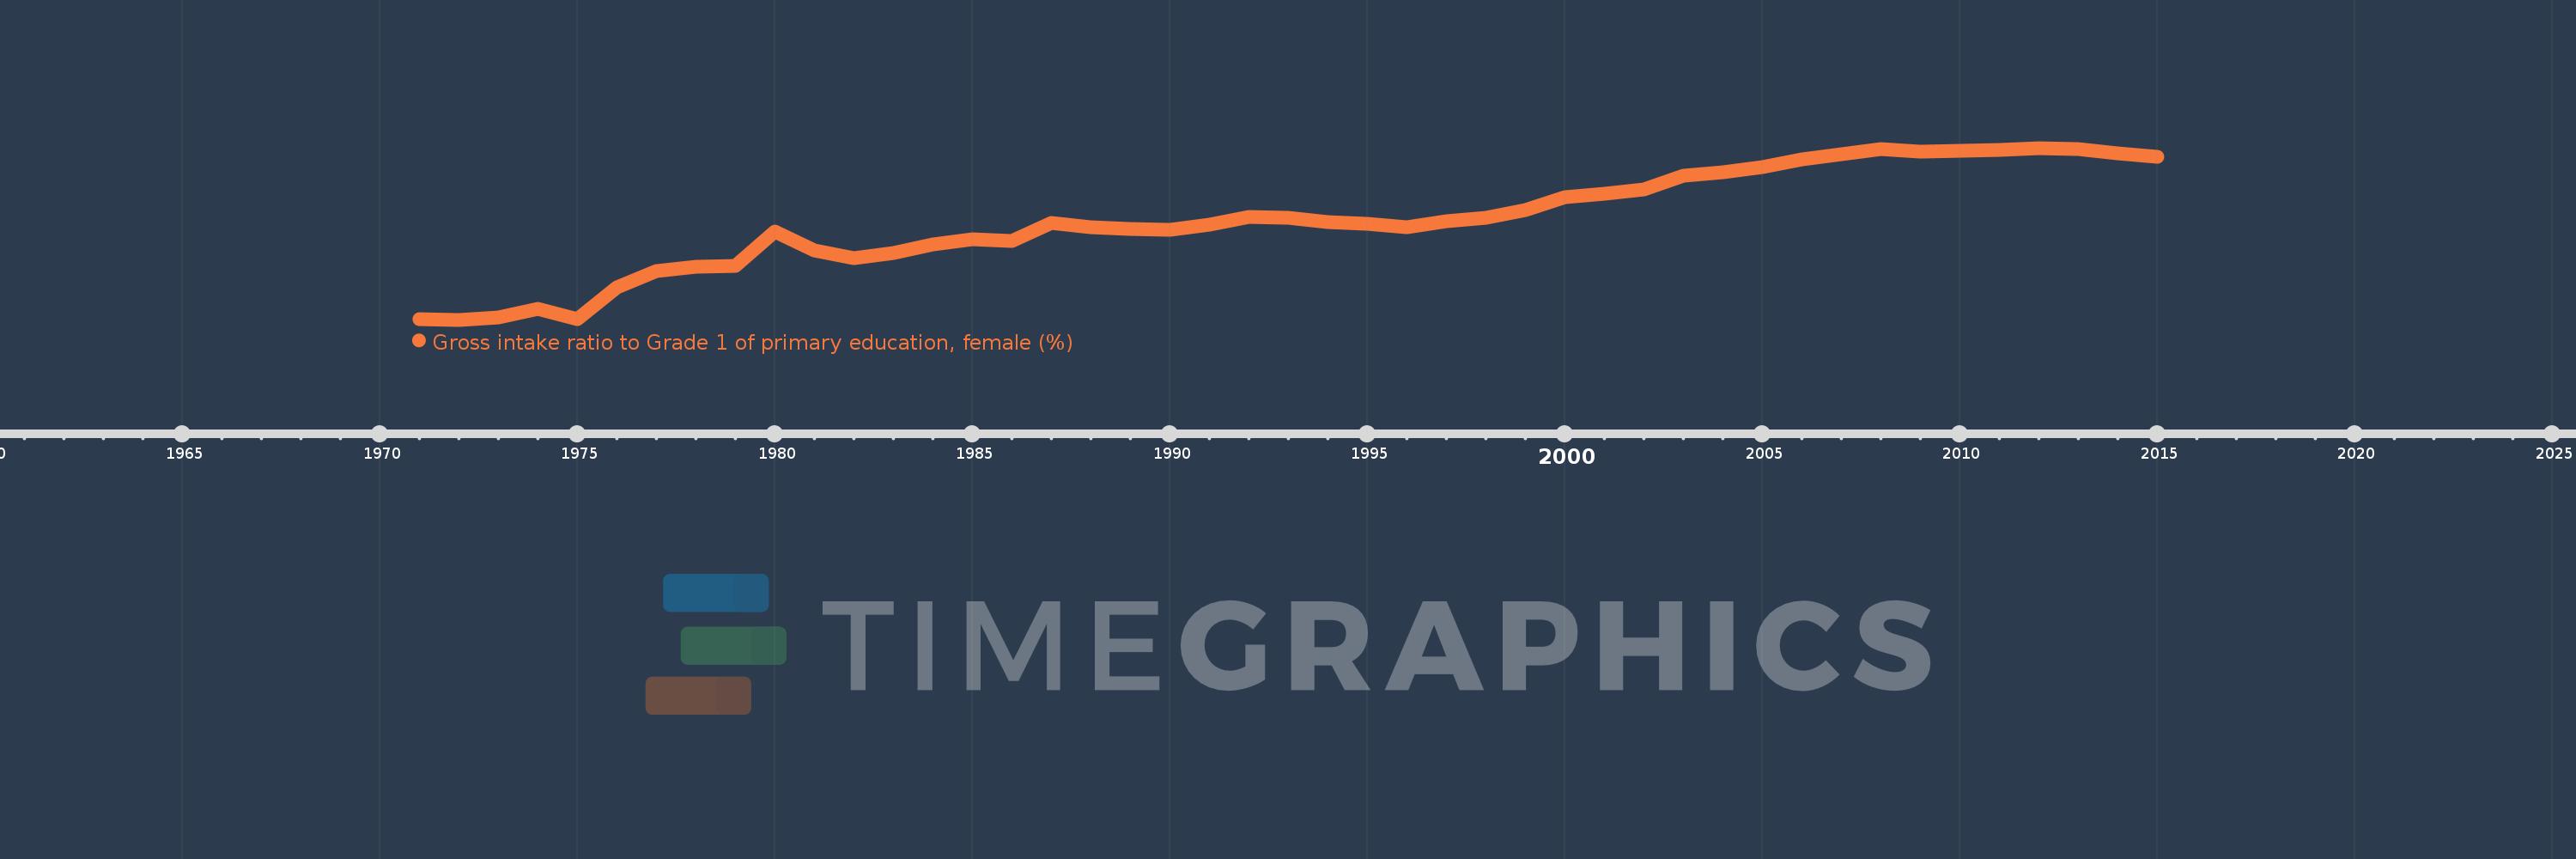
Gross intake ratio to Grade 1 of primary education, female (%)
2015,2014,2013,2012,2011,2010,2009,2008,2007,2006,2005,2004,2003,2002,2001,2000,1999,1998,1997,1996,1995,1994,1993,1992,1991,1990,1989,1988,1987,1986,1985,1984,1983,1982,1981,1980,1979,1978,1977,1976,1975,1974,1973,1972,1971
This statistics in other country:
AfghanistanAlbaniaAlgeriaAngolaAntigua and BarbudaArab WorldArgentinaArmeniaArubaAustriaAzerbaijanBahamas, TheBahrainBangladeshBarbadosBelarusBelgiumBelizeBeninBermudaBhutanBoliviaBosnia and HerzegovinaBotswanaBrazilBrunei DarussalamBulgariaBurkina FasoBurundiCabo VerdeCambodiaCameroonCanadaCaribbean small statesCentral African RepublicCentral Europe and the BalticsChadChileChinaColombiaComorosCongo, Dem. Rep.Congo, Rep.Costa RicaCote d'IvoireCroatiaCubaCyprusCzech RepublicDenmarkDjiboutiDominicaDominican RepublicEarly-demographic dividendEast Asia & PacificEast Asia & Pacific (excluding high income)East Asia & Pacific (IDA & IBRD countries)EcuadorEgypt, Arab Rep.El SalvadorEquatorial GuineaEritreaEstoniaEthiopiaEuro areaEurope & Central AsiaEurope & Central Asia (excluding high income)Europe & Central Asia (IDA & IBRD countries)European UnionFijiFinlandFragile and conflict affected situationsFranceGabonGambia, TheGeorgiaGermanyGhanaGreeceGrenadaGuatemalaGuineaGuinea-BissauGuyanaHaitiHeavily indebted poor countries (HIPC)High incomeHondurasHong Kong SAR, ChinaHungaryIBRD onlyIcelandIDA & IBRD totalIDA blendIDA onlyIDA totalIndiaIndonesiaIran, Islamic Rep.IraqIrelandIsraelItalyJamaicaJapanJordanKazakhstanKenyaKiribatiKorea, Dem. People’s Rep.Korea, Rep.KuwaitKyrgyz RepublicLao PDRLate-demographic dividendLatin America & Caribbean Latin America & Caribbean (excluding high income)Latin America & the Caribbean (IDA & IBRD countries)LatviaLeast developed countries: UN classificationLebanonLesothoLiberiaLibyaLiechtensteinLithuaniaLow & middle incomeLow incomeLower middle incomeLuxembourgMacao SAR, ChinaMacedonia, FYRMadagascarMalawiMaldivesMaliMaltaMarshall IslandsMauritaniaMauritiusMexicoMicronesia, Fed. Sts.Middle East & North AfricaMiddle East & North Africa (excluding high income)Middle East & North Africa (IDA & IBRD countries)Middle incomeMoldovaMongoliaMontenegroMoroccoMozambiqueMyanmarNamibiaNauruNepalNetherlandsNew ZealandNicaraguaNigerNigeriaNorth AmericaNorwayOECD membersOmanOther small statesPacific island small statesPakistanPalauPanamaPapua New GuineaParaguayPeruPhilippinesPolandPortugalPost-demographic dividendPre-demographic dividendPuerto RicoQatarRomaniaRussian FederationRwandaSamoaSan MarinoSao Tome and PrincipeSaudi ArabiaSenegalSerbiaSeychellesSierra LeoneSlovak RepublicSloveniaSmall statesSolomon IslandsSouth AfricaSouth AsiaSouth Asia (IDA & IBRD)South SudanSpainSri LankaSt. Kitts and NevisSt. LuciaSt. Vincent and the GrenadinesSub-Saharan Africa Sub-Saharan Africa (excluding high income)Sub-Saharan Africa (IDA & IBRD countries)SudanSurinameSwazilandSwedenSwitzerlandSyrian Arab RepublicTajikistanTanzaniaThailandTimor-LesteTogoTongaTrinidad and TobagoTunisiaTurkeyTuvaluUgandaUkraineUnited Arab EmiratesUnited StatesUpper middle incomeUruguayUzbekistanVanuatuVenezuela, RBVietnamWest Bank and GazaWorldYemen, Rep.ZambiaZimbabwe Timeline:
This timeline shows a graph from 1971 to 2015 of Middle East & North Africa (excluding high income). No data until 1970. Number of actual observations by date: 45.
Source name:
World Development Indicators
Source organization:
UNESCO Institute for Statistics
Categories, topics:
Education, Gender
Last updated:
apr 23, 2017
Indicators value changes by year
Minimum:
61.536
jan 1, 1972
Maximum:
106.09
jan 1, 2012
At the date of observation
Value
Absolute change
Change from previous value
jan 1, 1971
61.599
+61.599
0.0%
jan 1, 1972
61.536
-0.063
-0.1%
jan 1, 1973
62.167
+0.632
1.03%
jan 1, 1974
64.274
+2.107
3.39%
jan 1, 1975
61.596
-2.678
-4.17%
jan 1, 1976
69.969
+8.374
13.59%
jan 1, 1977
74.197
+4.228
6.04%
jan 1, 1978
75.351
+1.154
1.56%
jan 1, 1979
75.434
+0.083
0.11%
jan 1, 1980
84.502
+9.068
12.02%
jan 1, 1981
79.41
-5.092
-6.03%
jan 1, 1982
77.606
-1.804
-2.27%
jan 1, 1983
78.869
+1.264
1.63%
jan 1, 1984
81.106
+2.236
2.84%
jan 1, 1985
82.429
+1.323
1.63%
jan 1, 1986
81.876
-0.552
-0.67%
jan 1, 1987
86.57
+4.694
5.73%
jan 1, 1988
85.576
-0.994
-1.15%
jan 1, 1989
85.169
-0.407
-0.48%
jan 1, 1990
84.962
-0.207
-0.24%
jan 1, 1991
86.087
+1.125
1.32%
jan 1, 1992
88.225
+2.138
2.48%
jan 1, 1993
87.981
-0.244
-0.28%
jan 1, 1994
86.791
-1.189
-1.35%
jan 1, 1995
86.317
-0.474
-0.55%
jan 1, 1996
85.562
-0.755
-0.87%
jan 1, 1997
87.022
+1.46
1.71%
jan 1, 1998
88.075
+1.053
1.21%
jan 1, 1999
90.035
+1.959
2.22%
jan 1, 2000
93.276
+3.241
3.6%
jan 1, 2001
94.325
+1.049
1.12%
jan 1, 2002
95.225
+0.901
0.95%
jan 1, 2003
98.888
+3.663
3.85%
jan 1, 2004
99.692
+0.804
0.81%
jan 1, 2005
101.053
+1.36
1.36%
jan 1, 2006
103.159
+2.106
2.08%
jan 1, 2007
104.409
+1.25
1.21%
jan 1, 2008
105.871
+1.462
1.4%
jan 1, 2009
105.205
-0.666
-0.63%
jan 1, 2010
105.411
+0.207
0.2%
jan 1, 2011
105.671
+0.26
0.25%
jan 1, 2012
106.09
+0.418
0.4%
jan 1, 2013
105.902
-0.187
-0.18%
jan 1, 2014
104.625
-1.277
-1.21%
jan 1, 2015
103.866
-0.76
-0.73%
Ranking of countries by current statistics by years


Comments: