29
/
en
AIzaSyAYiBZKx7MnpbEhh9jyipgxe19OcubqV5w
April 1, 2024
82115
Belgium
BEL
true
2
1
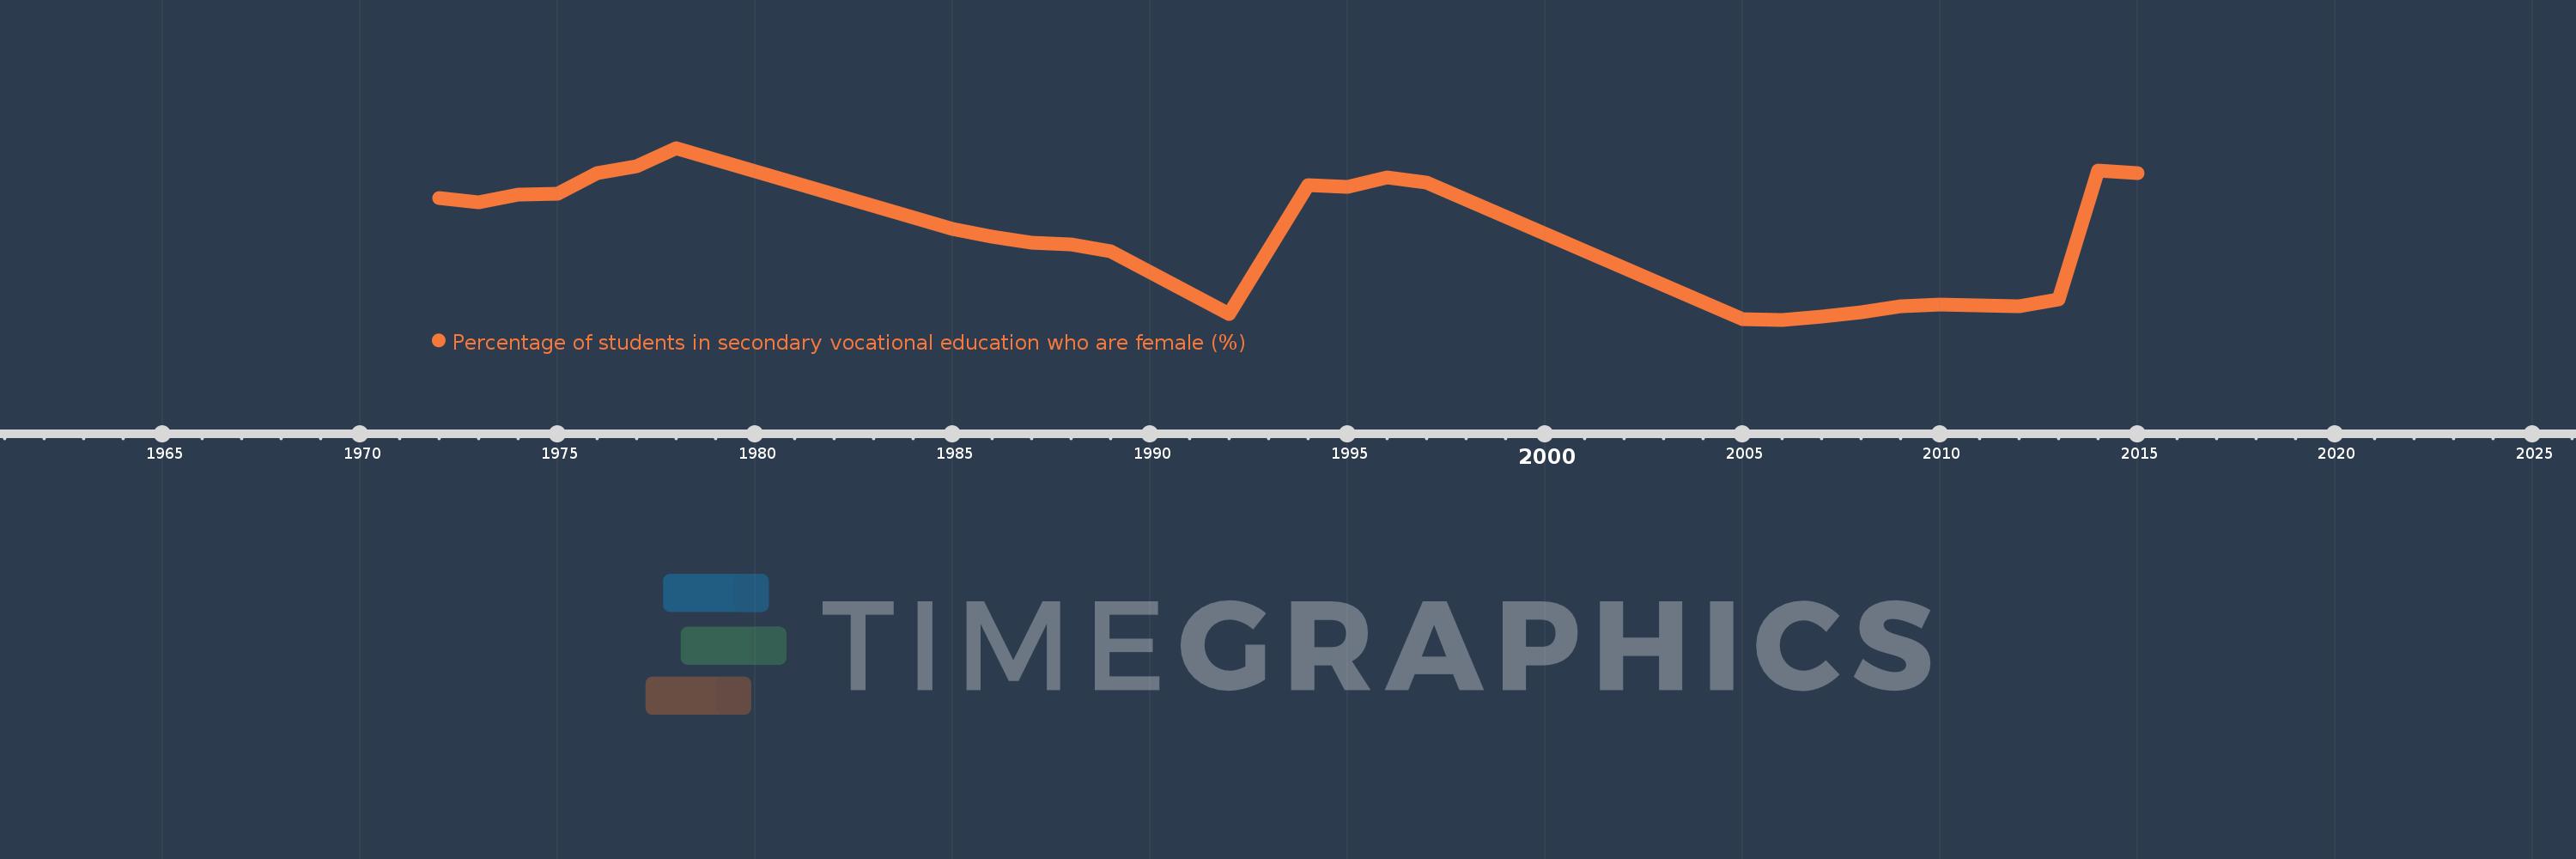
Percentage of students in secondary vocational education who are female (%)
2015,2014,2013,2012,2011,2010,2009,2008,2007,2006,2005,1997,1996,1995,1994,1992,1989,1988,1987,1986,1985,1978,1977,1976,1975,1974,1973,1972
This statistics in other country:
AfghanistanAlbaniaAlgeriaAndorraAngolaAntigua and BarbudaArab WorldArgentinaArmeniaArubaAustraliaAustriaAzerbaijanBahrainBangladeshBarbadosBelarusBelgiumBelizeBeninBermudaBhutanBoliviaBosnia and HerzegovinaBotswanaBrazilBritish Virgin IslandsBrunei DarussalamBulgariaBurkina FasoBurundiCabo VerdeCambodiaCameroonCanadaCaribbean small statesCentral African RepublicCentral Europe and the BalticsChadChileChinaColombiaComorosCongo, Dem. Rep.Congo, Rep.Costa RicaCote d'IvoireCroatiaCubaCuracaoCyprusCzech RepublicDenmarkDjiboutiDominicaDominican RepublicEarly-demographic dividendEast Asia & PacificEast Asia & Pacific (excluding high income)East Asia & Pacific (IDA & IBRD countries)EcuadorEgypt, Arab Rep.El SalvadorEquatorial GuineaEritreaEstoniaEthiopiaEuro areaEurope & Central AsiaEurope & Central Asia (excluding high income)Europe & Central Asia (IDA & IBRD countries)European UnionFijiFinlandFragile and conflict affected situationsFranceGabonGambia, TheGeorgiaGermanyGhanaGibraltarGreeceGrenadaGuatemalaGuineaGuinea-BissauGuyanaHaitiHeavily indebted poor countries (HIPC)High incomeHondurasHong Kong SAR, ChinaHungaryIBRD onlyIcelandIDA & IBRD totalIDA blendIDA onlyIDA totalIndiaIndonesiaIran, Islamic Rep.IraqIrelandIsraelItalyJamaicaJapanJordanKazakhstanKenyaKiribatiKorea, Rep.KuwaitKyrgyz RepublicLao PDRLate-demographic dividendLatin America & Caribbean Latin America & Caribbean (excluding high income)Latin America & the Caribbean (IDA & IBRD countries)LatviaLeast developed countries: UN classificationLebanonLesothoLiberiaLibyaLiechtensteinLithuaniaLow & middle incomeLow incomeLower middle incomeLuxembourgMacao SAR, ChinaMacedonia, FYRMadagascarMalawiMalaysiaMaldivesMaliMaltaMarshall IslandsMauritaniaMauritiusMexicoMicronesia, Fed. Sts.Middle East & North AfricaMiddle East & North Africa (excluding high income)Middle East & North Africa (IDA & IBRD countries)Middle incomeMoldovaMonacoMongoliaMontenegroMoroccoMozambiqueMyanmarNamibiaNauruNepalNetherlandsNew ZealandNicaraguaNigerNigeriaNorth AmericaNorwayOECD membersOmanOther small statesPacific island small statesPakistanPanamaPapua New GuineaParaguayPeruPolandPortugalPost-demographic dividendPre-demographic dividendPuerto RicoQatarRomaniaRussian FederationRwandaSamoaSan MarinoSao Tome and PrincipeSaudi ArabiaSenegalSerbiaSeychellesSierra LeoneSingaporeSint Maarten (Dutch part)Slovak RepublicSloveniaSmall statesSolomon IslandsSomaliaSouth AfricaSouth AsiaSouth Asia (IDA & IBRD)SpainSri LankaSt. Kitts and NevisSt. LuciaSt. Vincent and the GrenadinesSub-Saharan Africa Sub-Saharan Africa (excluding high income)Sub-Saharan Africa (IDA & IBRD countries)SudanSurinameSwazilandSwedenSwitzerlandSyrian Arab RepublicTajikistanTanzaniaThailandTimor-LesteTogoTongaTrinidad and TobagoTunisiaTurkeyTurkmenistanTurks and Caicos IslandsTuvaluUgandaUkraineUnited Arab EmiratesUnited KingdomUpper middle incomeUruguayUzbekistanVanuatuVenezuela, RBVietnamWest Bank and GazaWorldYemen, Rep.ZambiaZimbabwe Timeline:
This timeline shows a graph from 1972 to 2015 of Belgium. No data until 1971. Number of actual observations by date: 28.
Source name:
World Development Indicators
Source organization:
UNESCO Institute for Statistics
Categories, topics:
Education, Gender
Last updated:
apr 23, 2017
Indicators value changes by year
Minimum:
43.145
jan 1, 2006
Maximum:
52.619
jan 1, 1978
At the date of observation
Value
Absolute change
Change from previous value
jan 1, 1972
49.838
+49.838
0.0%
jan 1, 1973
49.603
-0.236
-0.47%
jan 1, 1974
50.032
+0.429
0.87%
jan 1, 1975
50.117
+0.085
0.17%
jan 1, 1976
51.242
+1.125
2.25%
jan 1, 1977
51.601
+0.359
0.7%
jan 1, 1978
52.619
+1.018
1.97%
jan 1, 1985
48.159
-4.46
-8.48%
jan 1, 1986
47.716
-0.443
-0.92%
jan 1, 1987
47.414
-0.302
-0.63%
jan 1, 1988
47.285
-0.129
-0.27%
jan 1, 1989
46.93
-0.355
-0.75%
jan 1, 1992
43.465
-3.464
-7.38%
jan 1, 1994
50.569
+7.103
16.34%
jan 1, 1995
50.471
-0.098
-0.19%
jan 1, 1996
50.994
+0.523
1.04%
jan 1, 1997
50.708
-0.286
-0.56%
jan 1, 2005
43.177
-7.531
-14.85%
jan 1, 2006
43.145
-0.032
-0.07%
jan 1, 2007
43.309
+0.164
0.38%
jan 1, 2008
43.548
+0.239
0.55%
jan 1, 2009
43.868
+0.321
0.74%
jan 1, 2010
43.978
+0.109
0.25%
jan 1, 2011
43.955
-0.023
-0.05%
jan 1, 2012
43.891
-0.064
-0.14%
jan 1, 2013
44.28
+0.388
0.89%
jan 1, 2014
51.376
+7.096
16.03%
jan 1, 2015
51.252
-0.124
-0.24%
Ranking of countries by current statistics by years


Comments: