29
/
en
AIzaSyAYiBZKx7MnpbEhh9jyipgxe19OcubqV5w
April 1, 2024
118300
Czech Republic
CZE
true
2
1
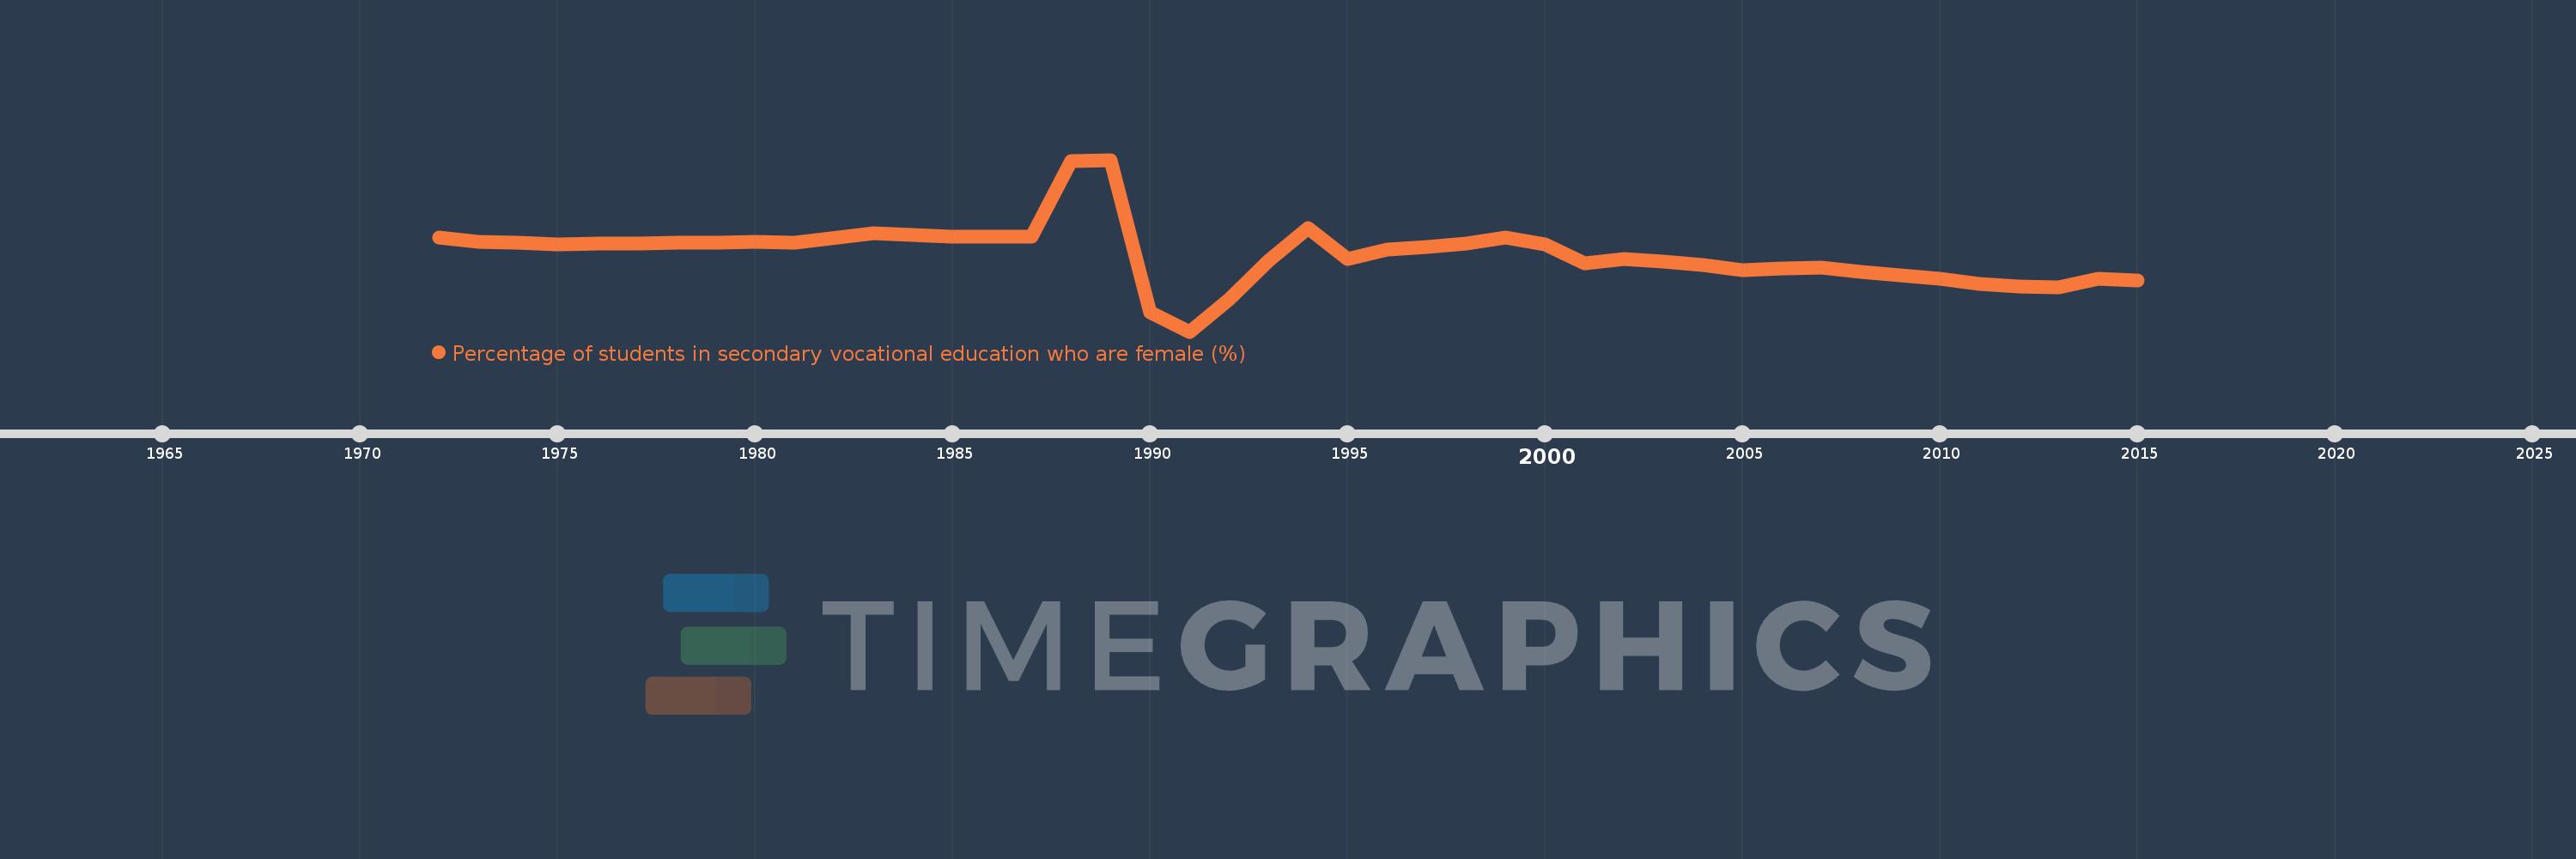
Percentage of students in secondary vocational education who are female (%)
2015,2014,2013,2012,2011,2010,2009,2008,2007,2006,2005,2004,2003,2002,2001,2000,1999,1998,1997,1996,1995,1994,1993,1992,1991,1990,1989,1988,1987,1986,1985,1984,1983,1981,1980,1979,1978,1977,1976,1975,1974,1973,1972
This statistics in other country:
AfghanistanAlbaniaAlgeriaAndorraAngolaAntigua and BarbudaArab WorldArgentinaArmeniaArubaAustraliaAustriaAzerbaijanBahrainBangladeshBarbadosBelarusBelgiumBelizeBeninBermudaBhutanBoliviaBosnia and HerzegovinaBotswanaBrazilBritish Virgin IslandsBrunei DarussalamBulgariaBurkina FasoBurundiCabo VerdeCambodiaCameroonCanadaCaribbean small statesCentral African RepublicCentral Europe and the BalticsChadChileChinaColombiaComorosCongo, Dem. Rep.Congo, Rep.Costa RicaCote d'IvoireCroatiaCubaCuracaoCyprusCzech RepublicDenmarkDjiboutiDominicaDominican RepublicEarly-demographic dividendEast Asia & PacificEast Asia & Pacific (excluding high income)East Asia & Pacific (IDA & IBRD countries)EcuadorEgypt, Arab Rep.El SalvadorEquatorial GuineaEritreaEstoniaEthiopiaEuro areaEurope & Central AsiaEurope & Central Asia (excluding high income)Europe & Central Asia (IDA & IBRD countries)European UnionFijiFinlandFragile and conflict affected situationsFranceGabonGambia, TheGeorgiaGermanyGhanaGibraltarGreeceGrenadaGuatemalaGuineaGuinea-BissauGuyanaHaitiHeavily indebted poor countries (HIPC)High incomeHondurasHong Kong SAR, ChinaHungaryIBRD onlyIcelandIDA & IBRD totalIDA blendIDA onlyIDA totalIndiaIndonesiaIran, Islamic Rep.IraqIrelandIsraelItalyJamaicaJapanJordanKazakhstanKenyaKiribatiKorea, Rep.KuwaitKyrgyz RepublicLao PDRLate-demographic dividendLatin America & Caribbean Latin America & Caribbean (excluding high income)Latin America & the Caribbean (IDA & IBRD countries)LatviaLeast developed countries: UN classificationLebanonLesothoLiberiaLibyaLiechtensteinLithuaniaLow & middle incomeLow incomeLower middle incomeLuxembourgMacao SAR, ChinaMacedonia, FYRMadagascarMalawiMalaysiaMaldivesMaliMaltaMarshall IslandsMauritaniaMauritiusMexicoMicronesia, Fed. Sts.Middle East & North AfricaMiddle East & North Africa (excluding high income)Middle East & North Africa (IDA & IBRD countries)Middle incomeMoldovaMonacoMongoliaMontenegroMoroccoMozambiqueMyanmarNamibiaNauruNepalNetherlandsNew ZealandNicaraguaNigerNigeriaNorth AmericaNorwayOECD membersOmanOther small statesPacific island small statesPakistanPanamaPapua New GuineaParaguayPeruPolandPortugalPost-demographic dividendPre-demographic dividendPuerto RicoQatarRomaniaRussian FederationRwandaSamoaSan MarinoSao Tome and PrincipeSaudi ArabiaSenegalSerbiaSeychellesSierra LeoneSingaporeSint Maarten (Dutch part)Slovak RepublicSloveniaSmall statesSolomon IslandsSomaliaSouth AfricaSouth AsiaSouth Asia (IDA & IBRD)SpainSri LankaSt. Kitts and NevisSt. LuciaSt. Vincent and the GrenadinesSub-Saharan Africa Sub-Saharan Africa (excluding high income)Sub-Saharan Africa (IDA & IBRD countries)SudanSurinameSwazilandSwedenSwitzerlandSyrian Arab RepublicTajikistanTanzaniaThailandTimor-LesteTogoTongaTrinidad and TobagoTunisiaTurkeyTurkmenistanTurks and Caicos IslandsTuvaluUgandaUkraineUnited Arab EmiratesUnited KingdomUpper middle incomeUruguayUzbekistanVanuatuVenezuela, RBVietnamWest Bank and GazaWorldYemen, Rep.ZambiaZimbabwe Timeline:
This timeline shows a graph from 1972 to 2015 of Czech Republic. No data until 1971. Number of actual observations by date: 43.
Source name:
World Development Indicators
Source organization:
UNESCO Institute for Statistics
Categories, topics:
Education, Gender
Last updated:
apr 23, 2017
Indicators value changes by year
Minimum:
40.182
jan 1, 1991
Maximum:
57.206
jan 1, 1989
At the date of observation
Value
Absolute change
Change from previous value
jan 1, 1972
49.512
+49.512
0.0%
jan 1, 1973
49.076
-0.436
-0.88%
jan 1, 1974
48.979
-0.097
-0.2%
jan 1, 1975
48.783
-0.196
-0.4%
jan 1, 1976
48.898
+0.115
0.24%
jan 1, 1977
48.935
+0.037
0.08%
jan 1, 1978
48.989
+0.054
0.11%
jan 1, 1979
49.027
+0.038
0.08%
jan 1, 1980
49.073
+0.046
0.09%
jan 1, 1981
48.97
-0.103
-0.21%
jan 1, 1983
49.903
+0.932
1.9%
jan 1, 1984
49.738
-0.164
-0.33%
jan 1, 1985
49.563
-0.175
-0.35%
jan 1, 1986
49.608
+0.046
0.09%
jan 1, 1987
49.598
-0.011
-0.02%
jan 1, 1988
57.068
+7.471
15.06%
jan 1, 1989
57.206
+0.137
0.24%
jan 1, 1990
42.08
-15.125
-26.44%
jan 1, 1991
40.182
-1.898
-4.51%
jan 1, 1992
43.387
+3.205
7.98%
jan 1, 1993
47.225
+3.838
8.85%
jan 1, 1994
50.467
+3.242
6.86%
jan 1, 1995
47.371
-3.095
-6.13%
jan 1, 1996
48.322
+0.951
2.01%
jan 1, 1997
48.525
+0.203
0.42%
jan 1, 1998
48.886
+0.361
0.74%
jan 1, 1999
49.478
+0.592
1.21%
jan 1, 2000
48.838
-0.64
-1.29%
jan 1, 2001
46.952
-1.887
-3.86%
jan 1, 2002
47.41
+0.458
0.98%
jan 1, 2003
47.1
-0.31
-0.65%
jan 1, 2004
46.813
-0.287
-0.61%
jan 1, 2005
46.269
-0.545
-1.16%
jan 1, 2006
46.433
+0.164
0.36%
jan 1, 2007
46.492
+0.059
0.13%
jan 1, 2008
46.138
-0.354
-0.76%
jan 1, 2009
45.797
-0.34
-0.74%
jan 1, 2010
45.445
-0.352
-0.77%
jan 1, 2011
44.921
-0.524
-1.15%
jan 1, 2012
44.625
-0.296
-0.66%
jan 1, 2013
44.548
-0.077
-0.17%
jan 1, 2014
45.414
+0.866
1.94%
jan 1, 2015
45.229
-0.185
-0.41%
Ranking of countries by current statistics by years


Comments: