29
/
en
AIzaSyAYiBZKx7MnpbEhh9jyipgxe19OcubqV5w
April 1, 2024
243006
Slovenia
SVN
true
2
1
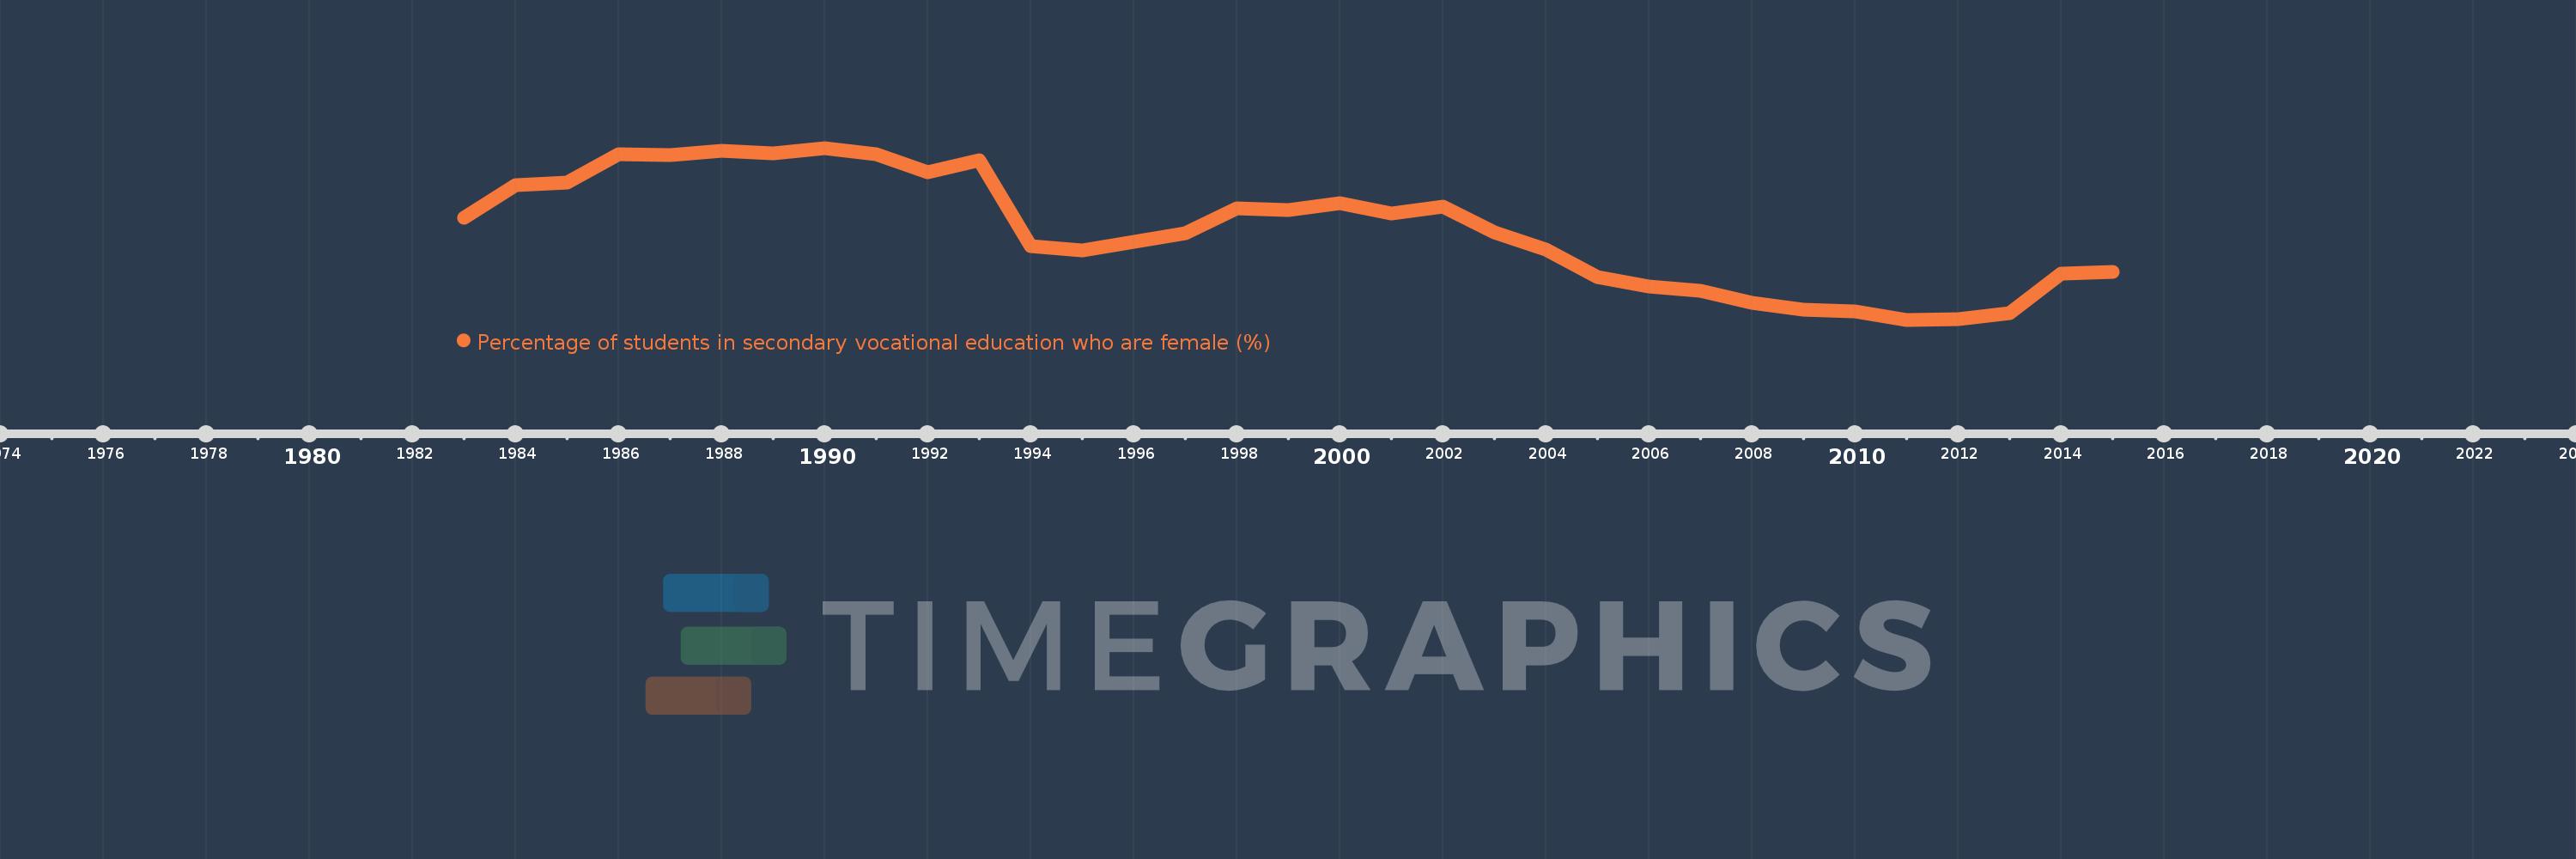
Percentage of students in secondary vocational education who are female (%)
2015,2014,2013,2012,2011,2010,2009,2008,2007,2006,2005,2004,2003,2002,2001,2000,1999,1998,1997,1996,1995,1994,1993,1992,1991,1990,1989,1988,1987,1986,1985,1984,1983
This statistics in other country:
AfghanistanAlbaniaAlgeriaAndorraAngolaAntigua and BarbudaArab WorldArgentinaArmeniaArubaAustraliaAustriaAzerbaijanBahrainBangladeshBarbadosBelarusBelgiumBelizeBeninBermudaBhutanBoliviaBosnia and HerzegovinaBotswanaBrazilBritish Virgin IslandsBrunei DarussalamBulgariaBurkina FasoBurundiCabo VerdeCambodiaCameroonCanadaCaribbean small statesCentral African RepublicCentral Europe and the BalticsChadChileChinaColombiaComorosCongo, Dem. Rep.Congo, Rep.Costa RicaCote d'IvoireCroatiaCubaCuracaoCyprusCzech RepublicDenmarkDjiboutiDominicaDominican RepublicEarly-demographic dividendEast Asia & PacificEast Asia & Pacific (excluding high income)East Asia & Pacific (IDA & IBRD countries)EcuadorEgypt, Arab Rep.El SalvadorEquatorial GuineaEritreaEstoniaEthiopiaEuro areaEurope & Central AsiaEurope & Central Asia (excluding high income)Europe & Central Asia (IDA & IBRD countries)European UnionFijiFinlandFragile and conflict affected situationsFranceGabonGambia, TheGeorgiaGermanyGhanaGibraltarGreeceGrenadaGuatemalaGuineaGuinea-BissauGuyanaHaitiHeavily indebted poor countries (HIPC)High incomeHondurasHong Kong SAR, ChinaHungaryIBRD onlyIcelandIDA & IBRD totalIDA blendIDA onlyIDA totalIndiaIndonesiaIran, Islamic Rep.IraqIrelandIsraelItalyJamaicaJapanJordanKazakhstanKenyaKiribatiKorea, Rep.KuwaitKyrgyz RepublicLao PDRLate-demographic dividendLatin America & Caribbean Latin America & Caribbean (excluding high income)Latin America & the Caribbean (IDA & IBRD countries)LatviaLeast developed countries: UN classificationLebanonLesothoLiberiaLibyaLiechtensteinLithuaniaLow & middle incomeLow incomeLower middle incomeLuxembourgMacao SAR, ChinaMacedonia, FYRMadagascarMalawiMalaysiaMaldivesMaliMaltaMarshall IslandsMauritaniaMauritiusMexicoMicronesia, Fed. Sts.Middle East & North AfricaMiddle East & North Africa (excluding high income)Middle East & North Africa (IDA & IBRD countries)Middle incomeMoldovaMonacoMongoliaMontenegroMoroccoMozambiqueMyanmarNamibiaNauruNepalNetherlandsNew ZealandNicaraguaNigerNigeriaNorth AmericaNorwayOECD membersOmanOther small statesPacific island small statesPakistanPanamaPapua New GuineaParaguayPeruPolandPortugalPost-demographic dividendPre-demographic dividendPuerto RicoQatarRomaniaRussian FederationRwandaSamoaSan MarinoSao Tome and PrincipeSaudi ArabiaSenegalSerbiaSeychellesSierra LeoneSingaporeSint Maarten (Dutch part)Slovak RepublicSloveniaSmall statesSolomon IslandsSomaliaSouth AfricaSouth AsiaSouth Asia (IDA & IBRD)SpainSri LankaSt. Kitts and NevisSt. LuciaSt. Vincent and the GrenadinesSub-Saharan Africa Sub-Saharan Africa (excluding high income)Sub-Saharan Africa (IDA & IBRD countries)SudanSurinameSwazilandSwedenSwitzerlandSyrian Arab RepublicTajikistanTanzaniaThailandTimor-LesteTogoTongaTrinidad and TobagoTunisiaTurkeyTurkmenistanTurks and Caicos IslandsTuvaluUgandaUkraineUnited Arab EmiratesUnited KingdomUpper middle incomeUruguayUzbekistanVanuatuVenezuela, RBVietnamWest Bank and GazaWorldYemen, Rep.ZambiaZimbabwe Timeline:
This timeline shows a graph from 1983 to 2015 of Slovenia. No data until 1982. Number of actual observations by date: 33.
Source name:
World Development Indicators
Source organization:
UNESCO Institute for Statistics
Categories, topics:
Education, Gender
Last updated:
apr 23, 2017
Indicators value changes by year
Minimum:
40.895
jan 1, 2011
Maximum:
49.945
jan 1, 1990
At the date of observation
Value
Absolute change
Change from previous value
jan 1, 1983
46.261
+46.261
0.0%
jan 1, 1984
47.968
+1.707
3.69%
jan 1, 1985
48.134
+0.166
0.35%
jan 1, 1986
49.623
+1.488
3.09%
jan 1, 1987
49.581
-0.042
-0.08%
jan 1, 1988
49.81
+0.229
0.46%
jan 1, 1989
49.669
-0.141
-0.28%
jan 1, 1990
49.945
+0.276
0.56%
jan 1, 1991
49.631
-0.314
-0.63%
jan 1, 1992
48.686
-0.944
-1.9%
jan 1, 1993
49.31
+0.623
1.28%
jan 1, 1994
44.766
-4.544
-9.22%
jan 1, 1995
44.567
-0.199
-0.44%
jan 1, 1996
45.008
+0.441
0.99%
jan 1, 1997
45.457
+0.449
1.0%
jan 1, 1998
46.758
+1.3
2.86%
jan 1, 1999
46.674
-0.084
-0.18%
jan 1, 2000
47.027
+0.353
0.76%
jan 1, 2001
46.501
-0.526
-1.12%
jan 1, 2002
46.875
+0.374
0.81%
jan 1, 2003
45.512
-1.363
-2.91%
jan 1, 2004
44.581
-0.931
-2.05%
jan 1, 2005
43.132
-1.449
-3.25%
jan 1, 2006
42.662
-0.47
-1.09%
jan 1, 2007
42.405
-0.257
-0.6%
jan 1, 2008
41.8
-0.605
-1.43%
jan 1, 2009
41.413
-0.387
-0.93%
jan 1, 2010
41.334
-0.08
-0.19%
jan 1, 2011
40.895
-0.439
-1.06%
jan 1, 2012
40.942
+0.047
0.12%
jan 1, 2013
41.264
+0.321
0.78%
jan 1, 2014
43.329
+2.066
5.01%
jan 1, 2015
43.405
+0.076
0.18%
Ranking of countries by current statistics by years


Comments: