29
/
en
AIzaSyAYiBZKx7MnpbEhh9jyipgxe19OcubqV5w
April 1, 2024
257676
Switzerland
CHE
true
2
1
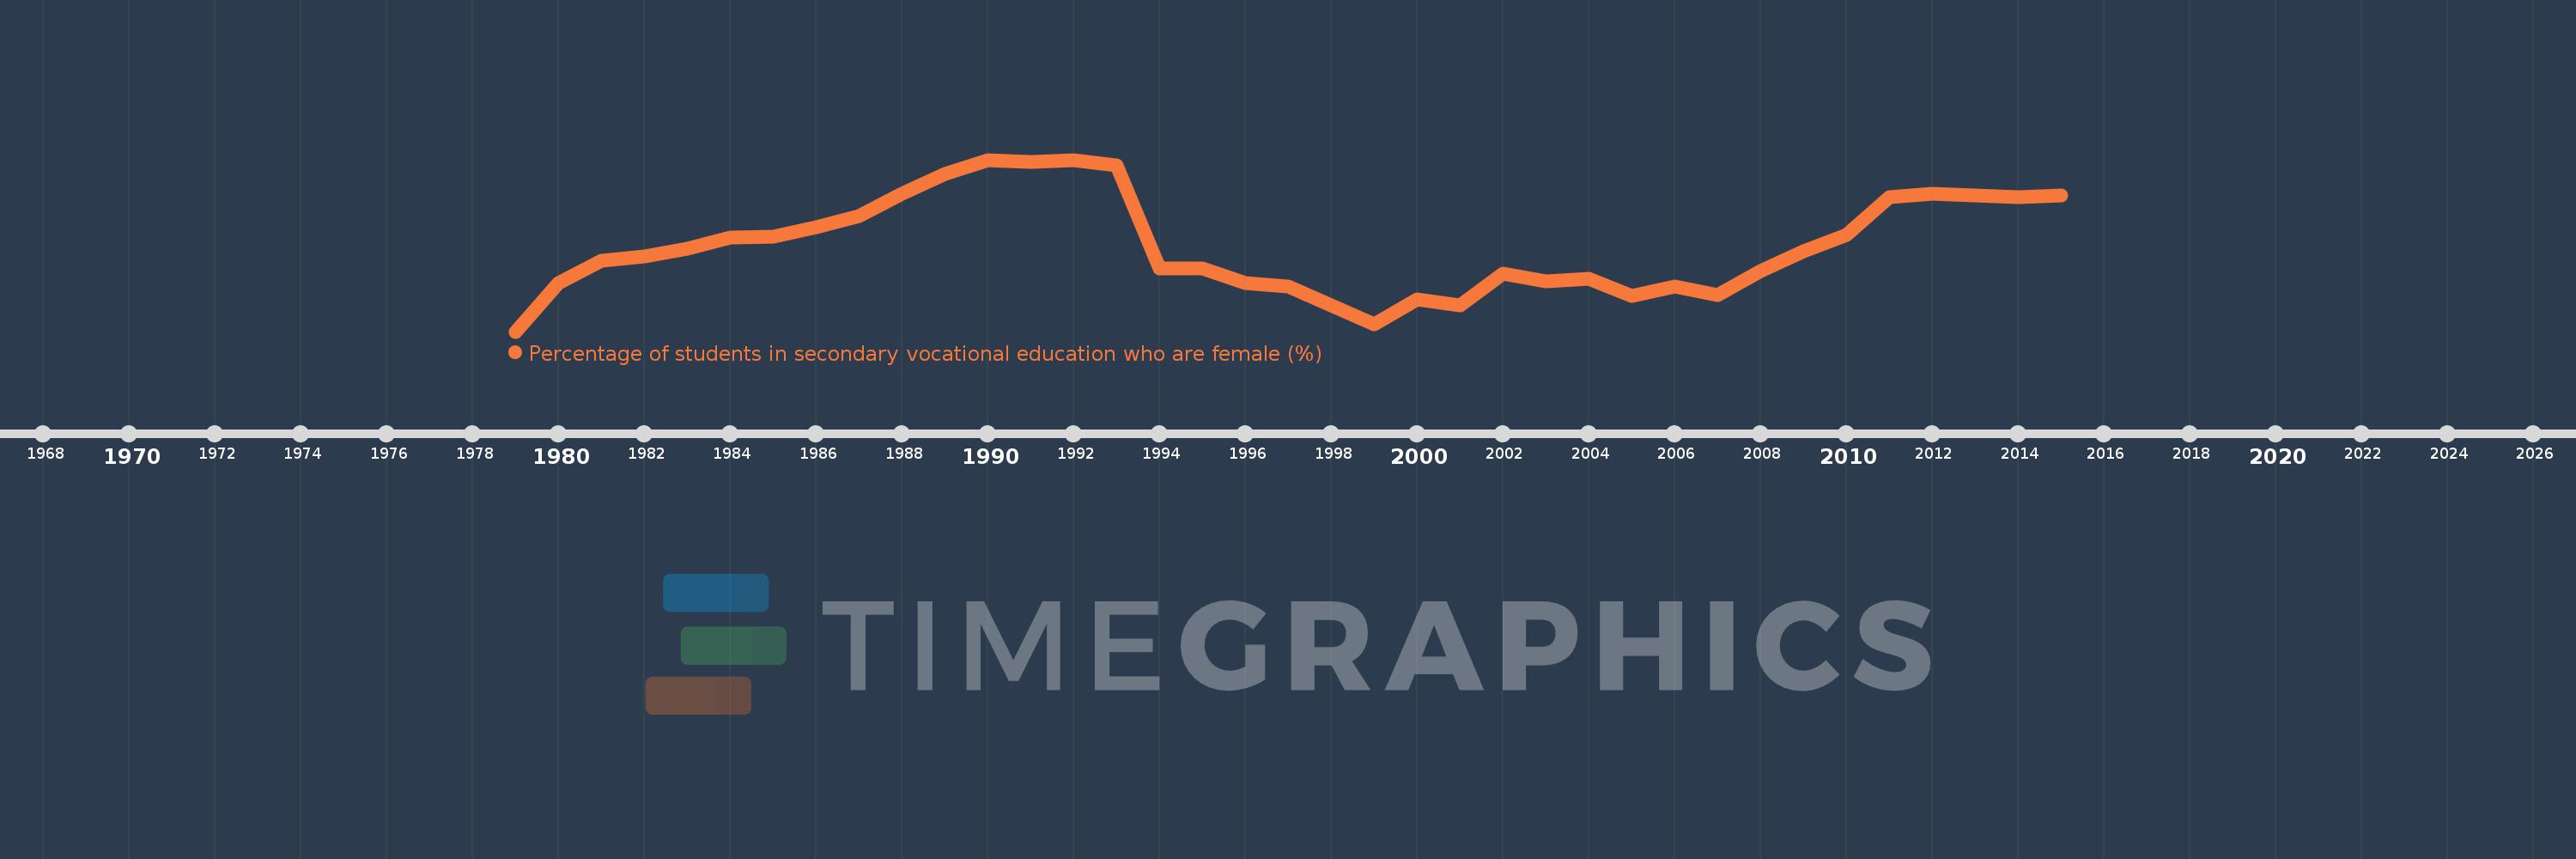
Percentage of students in secondary vocational education who are female (%)
2015,2014,2013,2012,2011,2010,2009,2008,2007,2006,2005,2004,2003,2002,2001,2000,1999,1997,1996,1995,1994,1993,1992,1991,1990,1989,1988,1987,1986,1985,1984,1983,1982,1981,1980,1979
This statistics in other country:
AfghanistanAlbaniaAlgeriaAndorraAngolaAntigua and BarbudaArab WorldArgentinaArmeniaArubaAustraliaAustriaAzerbaijanBahrainBangladeshBarbadosBelarusBelgiumBelizeBeninBermudaBhutanBoliviaBosnia and HerzegovinaBotswanaBrazilBritish Virgin IslandsBrunei DarussalamBulgariaBurkina FasoBurundiCabo VerdeCambodiaCameroonCanadaCaribbean small statesCentral African RepublicCentral Europe and the BalticsChadChileChinaColombiaComorosCongo, Dem. Rep.Congo, Rep.Costa RicaCote d'IvoireCroatiaCubaCuracaoCyprusCzech RepublicDenmarkDjiboutiDominicaDominican RepublicEarly-demographic dividendEast Asia & PacificEast Asia & Pacific (excluding high income)East Asia & Pacific (IDA & IBRD countries)EcuadorEgypt, Arab Rep.El SalvadorEquatorial GuineaEritreaEstoniaEthiopiaEuro areaEurope & Central AsiaEurope & Central Asia (excluding high income)Europe & Central Asia (IDA & IBRD countries)European UnionFijiFinlandFragile and conflict affected situationsFranceGabonGambia, TheGeorgiaGermanyGhanaGibraltarGreeceGrenadaGuatemalaGuineaGuinea-BissauGuyanaHaitiHeavily indebted poor countries (HIPC)High incomeHondurasHong Kong SAR, ChinaHungaryIBRD onlyIcelandIDA & IBRD totalIDA blendIDA onlyIDA totalIndiaIndonesiaIran, Islamic Rep.IraqIrelandIsraelItalyJamaicaJapanJordanKazakhstanKenyaKiribatiKorea, Rep.KuwaitKyrgyz RepublicLao PDRLate-demographic dividendLatin America & Caribbean Latin America & Caribbean (excluding high income)Latin America & the Caribbean (IDA & IBRD countries)LatviaLeast developed countries: UN classificationLebanonLesothoLiberiaLibyaLiechtensteinLithuaniaLow & middle incomeLow incomeLower middle incomeLuxembourgMacao SAR, ChinaMacedonia, FYRMadagascarMalawiMalaysiaMaldivesMaliMaltaMarshall IslandsMauritaniaMauritiusMexicoMicronesia, Fed. Sts.Middle East & North AfricaMiddle East & North Africa (excluding high income)Middle East & North Africa (IDA & IBRD countries)Middle incomeMoldovaMonacoMongoliaMontenegroMoroccoMozambiqueMyanmarNamibiaNauruNepalNetherlandsNew ZealandNicaraguaNigerNigeriaNorth AmericaNorwayOECD membersOmanOther small statesPacific island small statesPakistanPanamaPapua New GuineaParaguayPeruPolandPortugalPost-demographic dividendPre-demographic dividendPuerto RicoQatarRomaniaRussian FederationRwandaSamoaSan MarinoSao Tome and PrincipeSaudi ArabiaSenegalSerbiaSeychellesSierra LeoneSingaporeSint Maarten (Dutch part)Slovak RepublicSloveniaSmall statesSolomon IslandsSomaliaSouth AfricaSouth AsiaSouth Asia (IDA & IBRD)SpainSri LankaSt. Kitts and NevisSt. LuciaSt. Vincent and the GrenadinesSub-Saharan Africa Sub-Saharan Africa (excluding high income)Sub-Saharan Africa (IDA & IBRD countries)SudanSurinameSwazilandSwedenSwitzerlandSyrian Arab RepublicTajikistanTanzaniaThailandTimor-LesteTogoTongaTrinidad and TobagoTunisiaTurkeyTurkmenistanTurks and Caicos IslandsTuvaluUgandaUkraineUnited Arab EmiratesUnited KingdomUpper middle incomeUruguayUzbekistanVanuatuVenezuela, RBVietnamWest Bank and GazaWorldYemen, Rep.ZambiaZimbabwe Timeline:
This timeline shows a graph from 1979 to 2015 of Switzerland. No data until 1978. Number of actual observations by date: 36.
Source name:
World Development Indicators
Source organization:
UNESCO Institute for Statistics
Categories, topics:
Education, Gender
Last updated:
apr 23, 2017
Indicators value changes by year
Minimum:
38.557
jan 1, 1979
Maximum:
43.239
jan 1, 1990
At the date of observation
Value
Absolute change
Change from previous value
jan 1, 1979
38.557
+38.557
0.0%
jan 1, 1980
39.875
+1.318
3.42%
jan 1, 1981
40.481
+0.606
1.52%
jan 1, 1982
40.595
+0.114
0.28%
jan 1, 1983
40.827
+0.232
0.57%
jan 1, 1984
41.12
+0.294
0.72%
jan 1, 1985
41.149
+0.029
0.07%
jan 1, 1986
41.399
+0.25
0.61%
jan 1, 1987
41.716
+0.317
0.77%
jan 1, 1988
42.315
+0.599
1.44%
jan 1, 1989
42.854
+0.539
1.27%
jan 1, 1990
43.239
+0.385
0.9%
jan 1, 1991
43.172
-0.067
-0.15%
jan 1, 1992
43.238
+0.066
0.15%
jan 1, 1993
43.087
-0.15
-0.35%
jan 1, 1994
40.282
-2.806
-6.51%
jan 1, 1995
40.269
-0.013
-0.03%
jan 1, 1996
39.876
-0.392
-0.97%
jan 1, 1997
39.777
-0.1
-0.25%
jan 1, 1999
38.759
-1.017
-2.56%
jan 1, 2000
39.442
+0.683
1.76%
jan 1, 2001
39.271
-0.171
-0.43%
jan 1, 2002
40.134
+0.863
2.2%
jan 1, 2003
39.922
-0.213
-0.53%
jan 1, 2004
39.988
+0.066
0.17%
jan 1, 2005
39.533
-0.455
-1.14%
jan 1, 2006
39.778
+0.245
0.62%
jan 1, 2007
39.546
-0.232
-0.58%
jan 1, 2008
40.204
+0.658
1.66%
jan 1, 2009
40.737
+0.533
1.33%
jan 1, 2010
41.191
+0.454
1.11%
jan 1, 2011
42.213
+1.022
2.48%
jan 1, 2012
42.305
+0.092
0.22%
jan 1, 2013
42.261
-0.045
-0.11%
jan 1, 2014
42.229
-0.032
-0.08%
jan 1, 2015
42.266
+0.037
0.09%
Ranking of countries by current statistics by years


Comments: