29
/
en
AIzaSyAYiBZKx7MnpbEhh9jyipgxe19OcubqV5w
April 1, 2024
159781
Ireland
IRL
true
2
1
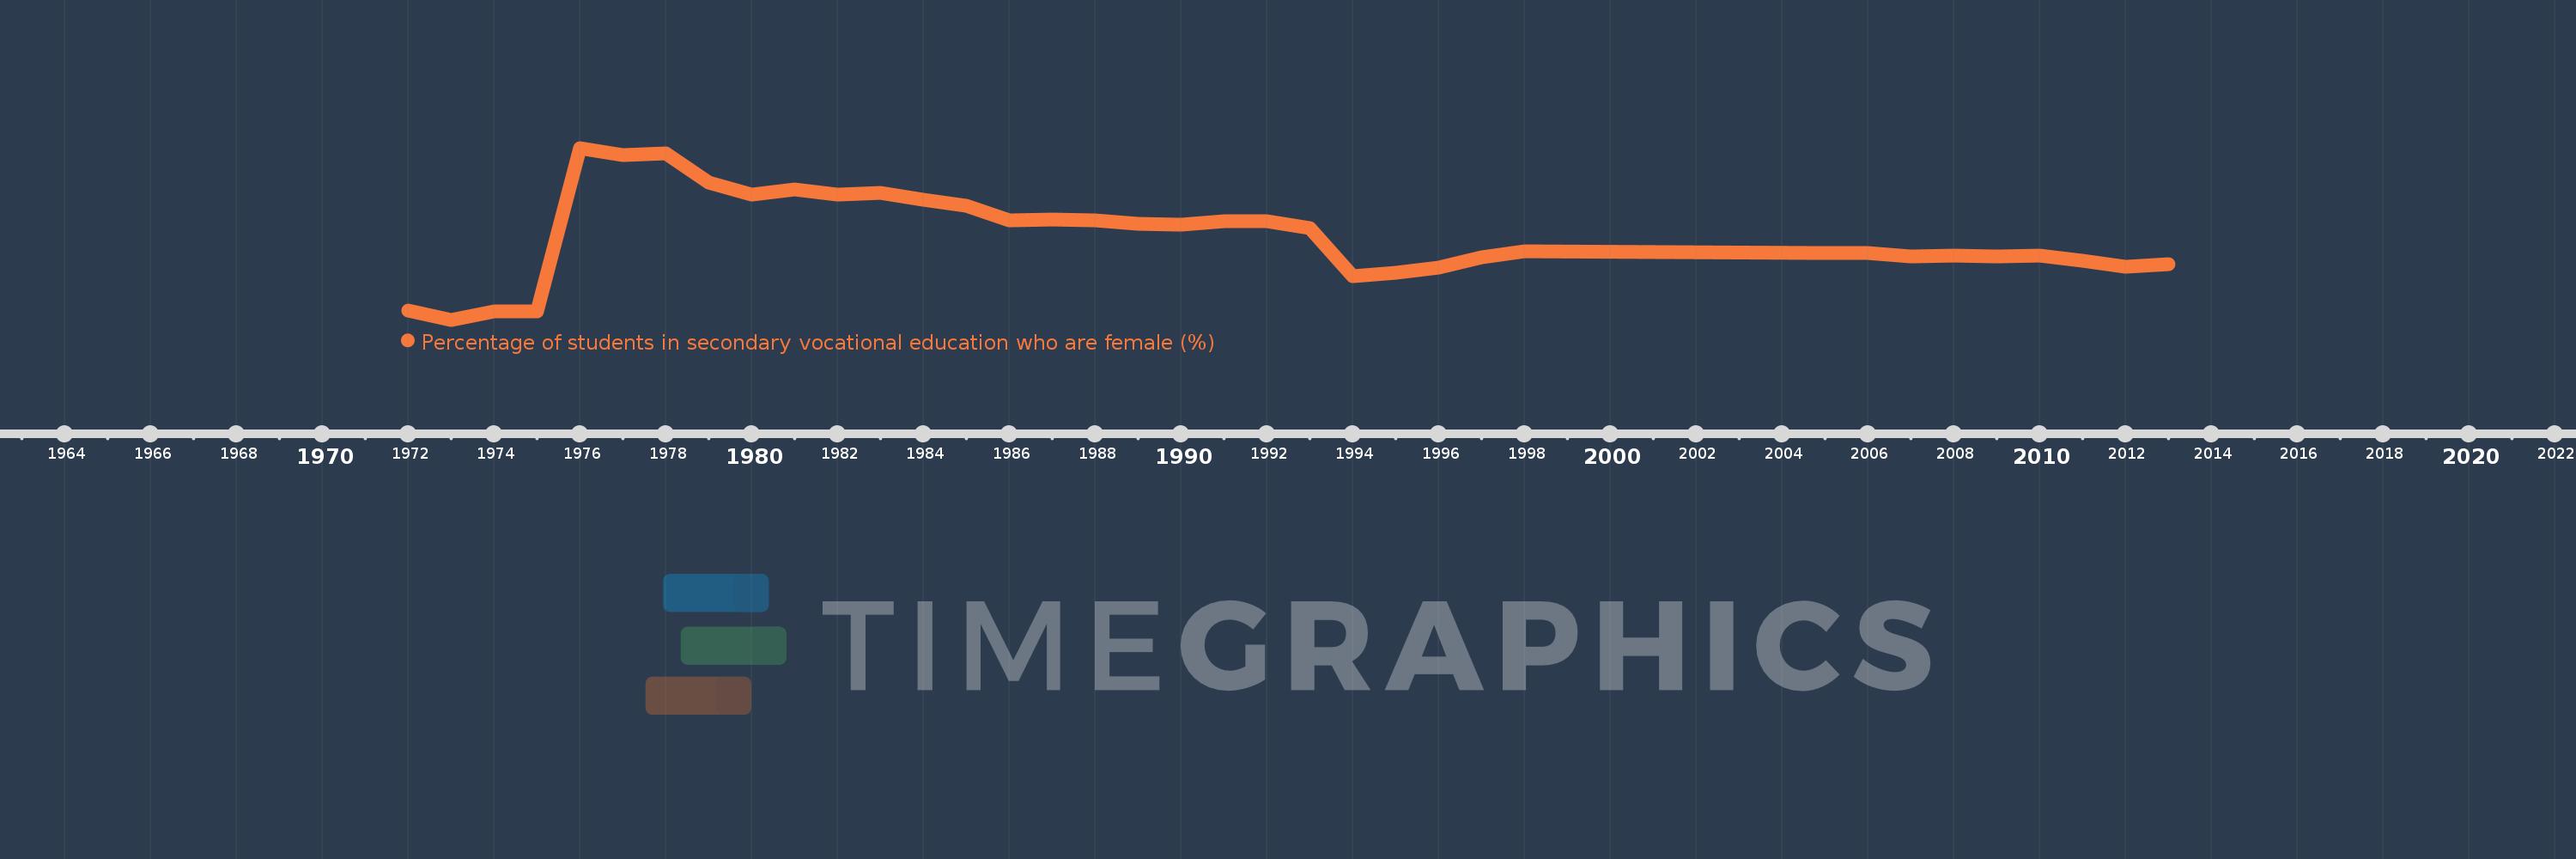
Percentage of students in secondary vocational education who are female (%)
2013,2012,2011,2010,2009,2008,2007,2006,2005,1998,1997,1996,1995,1994,1993,1992,1991,1990,1989,1988,1987,1986,1985,1984,1983,1982,1981,1980,1979,1978,1977,1976,1975,1974,1973,1972
This statistics in other country:
AfghanistanAlbaniaAlgeriaAndorraAngolaAntigua and BarbudaArab WorldArgentinaArmeniaArubaAustraliaAustriaAzerbaijanBahrainBangladeshBarbadosBelarusBelgiumBelizeBeninBermudaBhutanBoliviaBosnia and HerzegovinaBotswanaBrazilBritish Virgin IslandsBrunei DarussalamBulgariaBurkina FasoBurundiCabo VerdeCambodiaCameroonCanadaCaribbean small statesCentral African RepublicCentral Europe and the BalticsChadChileChinaColombiaComorosCongo, Dem. Rep.Congo, Rep.Costa RicaCote d'IvoireCroatiaCubaCuracaoCyprusCzech RepublicDenmarkDjiboutiDominicaDominican RepublicEarly-demographic dividendEast Asia & PacificEast Asia & Pacific (excluding high income)East Asia & Pacific (IDA & IBRD countries)EcuadorEgypt, Arab Rep.El SalvadorEquatorial GuineaEritreaEstoniaEthiopiaEuro areaEurope & Central AsiaEurope & Central Asia (excluding high income)Europe & Central Asia (IDA & IBRD countries)European UnionFijiFinlandFragile and conflict affected situationsFranceGabonGambia, TheGeorgiaGermanyGhanaGibraltarGreeceGrenadaGuatemalaGuineaGuinea-BissauGuyanaHaitiHeavily indebted poor countries (HIPC)High incomeHondurasHong Kong SAR, ChinaHungaryIBRD onlyIcelandIDA & IBRD totalIDA blendIDA onlyIDA totalIndiaIndonesiaIran, Islamic Rep.IraqIrelandIsraelItalyJamaicaJapanJordanKazakhstanKenyaKiribatiKorea, Rep.KuwaitKyrgyz RepublicLao PDRLate-demographic dividendLatin America & Caribbean Latin America & Caribbean (excluding high income)Latin America & the Caribbean (IDA & IBRD countries)LatviaLeast developed countries: UN classificationLebanonLesothoLiberiaLibyaLiechtensteinLithuaniaLow & middle incomeLow incomeLower middle incomeLuxembourgMacao SAR, ChinaMacedonia, FYRMadagascarMalawiMalaysiaMaldivesMaliMaltaMarshall IslandsMauritaniaMauritiusMexicoMicronesia, Fed. Sts.Middle East & North AfricaMiddle East & North Africa (excluding high income)Middle East & North Africa (IDA & IBRD countries)Middle incomeMoldovaMonacoMongoliaMontenegroMoroccoMozambiqueMyanmarNamibiaNauruNepalNetherlandsNew ZealandNicaraguaNigerNigeriaNorth AmericaNorwayOECD membersOmanOther small statesPacific island small statesPakistanPanamaPapua New GuineaParaguayPeruPolandPortugalPost-demographic dividendPre-demographic dividendPuerto RicoQatarRomaniaRussian FederationRwandaSamoaSan MarinoSao Tome and PrincipeSaudi ArabiaSenegalSerbiaSeychellesSierra LeoneSingaporeSint Maarten (Dutch part)Slovak RepublicSloveniaSmall statesSolomon IslandsSomaliaSouth AfricaSouth AsiaSouth Asia (IDA & IBRD)SpainSri LankaSt. Kitts and NevisSt. LuciaSt. Vincent and the GrenadinesSub-Saharan Africa Sub-Saharan Africa (excluding high income)Sub-Saharan Africa (IDA & IBRD countries)SudanSurinameSwazilandSwedenSwitzerlandSyrian Arab RepublicTajikistanTanzaniaThailandTimor-LesteTogoTongaTrinidad and TobagoTunisiaTurkeyTurkmenistanTurks and Caicos IslandsTuvaluUgandaUkraineUnited Arab EmiratesUnited KingdomUpper middle incomeUruguayUzbekistanVanuatuVenezuela, RBVietnamWest Bank and GazaWorldYemen, Rep.ZambiaZimbabwe Timeline:
This timeline shows a graph from 1972 to 2013 of Ireland. No data until 1971. Number of actual observations by date: 36.
Source name:
World Development Indicators
Source organization:
UNESCO Institute for Statistics
Categories, topics:
Education, Gender
Last updated:
apr 23, 2017
Indicators value changes by year
Minimum:
35.719
jan 1, 1973
Maximum:
84.883
jan 1, 1976
At the date of observation
Value
Absolute change
Change from previous value
jan 1, 1972
38.461
+38.461
0.0%
jan 1, 1973
35.719
-2.742
-7.13%
jan 1, 1974
38.017
+2.298
6.43%
jan 1, 1975
38.007
-0.01
-0.03%
jan 1, 1976
84.883
+46.877
123.34%
jan 1, 1977
82.856
-2.027
-2.39%
jan 1, 1978
83.268
+0.412
0.5%
jan 1, 1979
75.04
-8.229
-9.88%
jan 1, 1980
71.593
-3.446
-4.59%
jan 1, 1981
72.998
+1.405
1.96%
jan 1, 1982
71.585
-1.413
-1.94%
jan 1, 1983
71.908
+0.323
0.45%
jan 1, 1984
69.971
-1.938
-2.69%
jan 1, 1985
68.259
-1.712
-2.45%
jan 1, 1986
64.18
-4.078
-5.98%
jan 1, 1987
64.286
+0.106
0.17%
jan 1, 1988
64.197
-0.09
-0.14%
jan 1, 1989
63.066
-1.131
-1.76%
jan 1, 1990
62.836
-0.229
-0.36%
jan 1, 1991
63.826
+0.99
1.57%
jan 1, 1992
63.984
+0.158
0.25%
jan 1, 1993
62.006
-1.977
-3.09%
jan 1, 1994
48.179
-13.828
-22.3%
jan 1, 1995
49.21
+1.031
2.14%
jan 1, 1996
50.58
+1.37
2.78%
jan 1, 1997
53.526
+2.947
5.83%
jan 1, 1998
55.198
+1.671
3.12%
jan 1, 2005
54.719
-0.478
-0.87%
jan 1, 2006
54.861
+0.142
0.26%
jan 1, 2007
53.867
-0.994
-1.81%
jan 1, 2008
53.965
+0.098
0.18%
jan 1, 2009
53.916
-0.05
-0.09%
jan 1, 2010
54.042
+0.126
0.23%
jan 1, 2011
52.602
-1.44
-2.67%
jan 1, 2012
50.909
-1.692
-3.22%
jan 1, 2013
51.642
+0.733
1.44%
Ranking of countries by current statistics by years


Comments: